
Page 134 - Contributed Paper Session (CPS) - Volume 4
P. 134
CPS2156 Luis Sanguiao Sande
For the random forest modelling the R package ranger was used. The
election of this particular package was because it is quite fast (multithreaded)
and returns the out of bag predictions that we need to correct the bias.
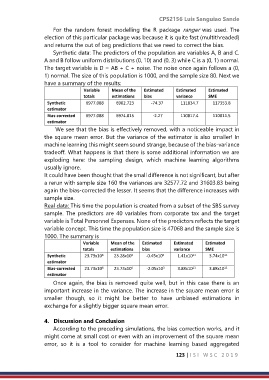
Synthetic data: The predictors of the population are variables A, B and C.
A and B follow uniform distributions (0, 10) and (0, 3) while C is a (0, 1) normal.
The target variable is D = AB + C + noise. The noise once again follows a (0,
1) normal. The size of this population is 1000, and the sample size 80. Next we
have a summary of the results:
Variable Mean of the Estimated Estimated Estimated
totals estimations bias variance SME
Synthetic 6977.088 6902.723 -74.37 111834.7 117353.8
estimator
Bias-corrected 6977.088 6974.815 -2.27 110817.4 110811.5
estimator
We see that the bias is effectively removed, with a noticeable impact in
the square mean error. But the variance of the estimator is also smaller! In
machine learning this might seem sound strange, because of the bias-variance
tradeoff. What happens is that there is some additional information we are
exploding here: the sampling design, which machine learning algorithms
usually ignore.
It could have been thought that the small difference is not significant, but after
a rerun with sample size 160 the variances are 32577.72 and 31603.83 being
again the bias-corrected the lesser. It seems that the difference increases with
sample size.
Real data: This time the population is created from a subset of the SBS survey
sample. The predictors are 40 variables from corporate tax and the target
variable is Total Personnel Expenses. None of the predictors reflects the target
variable concept. This time the population size is 47068 and the sample size is
1000. The summary is
Variable Mean of the Estimated Estimated Estimated
totals estimations bias variance SME
6
11
6
11
6
Synthetic 23.73x10 23.28x10 -0.45x10 1.41x10 3.74x10
estimator
11
3
6
6
11
Bias-corrected 23.73x10 23.73x10 -2.05x10 3.88x10 3.88x10
estimator
Once again, the bias is removed quite well, but in this case there is an
important increase in the variance. The increase in the square mean error is
smaller though, so it might be better to have unbiased estimations in
exchange for a slightly bigger square mean error.
4. Discussion and Conclusion
According to the preceding simulations, the bias correction works, and it
might come at small cost or even with an improvement of the square mean
error, so it is a tool to consider for machine learning based aggregated
123 | I S I W S C 2 0 1 9