
Page 186 - Contributed Paper Session (CPS) - Volume 4
P. 186
CPS2169 Carmen D. Tekwe et al.
intercept for the nested effects of teachers within schools was statistically
significant (p=0.04).
Results from LRM
The LRM summarizes the high dimensional measures of SDEE per subject
to a scalar-valued measure. This summary scalar-valued measures were
obtained by computing the arithmetic mean of all measures of SDEE by
subject.
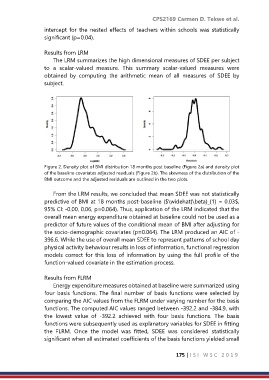
Figure 2. Density plot of BMI distribution 18 months post baseline (Figure 2a) and density plot
of the baseline covariates adjusted residuals (Figure 2b). The skewness of the distribution of the
BMI outcome and the adjusted residuals are outlined in the two plots.
From the LRM results, we concluded that mean SDEE was not statistically
predictive of BMI at 18 months post-baseline ($\widehat{\beta}_{1} = 0.03$,
95% CI: -0.00, 0.06, p=0.064). Thus, application of the LRM indicated that the
overall mean energy expenditure obtained at baseline could not be used as a
predictor of future values of the conditional mean of BMI after adjusting for
the socio-demographic covariates (p=0.064). The LRM produced an AIC of -
396.6. While the use of overall mean SDEE to represent patterns of school day
physical activity behaviour results in loss of information, functional regression
models correct for this loss of information by using the full profile of the
function-valued covariate in the estimation process.
Results from FLRM
Energy expenditure measures obtained at baseline were summarized using
four basis functions. The final number of basis functions were selected by
comparing the AIC values from the FLRM under varying number for the basis
functions. The computed AIC values ranged between -392.2 and -384.9, with
the lowest value of -392.2 achieved with four basis functions. The basis
functions were subsequently used as explanatory variables for SDEE in fitting
the FLRM. Once the model was fitted, SDEE was considered statistically
significant when all estimated coefficients of the basis functions yielded small
175 | I S I W S C 2 0 1 9