
Page 183 - Contributed Paper Session (CPS) - Volume 4
P. 183
CPS2169 Carmen D. Tekwe et al.
represented by curves rather than scalar valued summary numbers (Tekwe, et
al. 2018). Functional data analysis focuses on the analyses of experimental data
collected as curves, functions or images and treats the curves as the unit of
statistical analysis (Silverman, et al. 2005).
Parametric regression approaches have been considered in functional data
settings (Eubank, et al. 1999). In these settings, the exact forms of the
regression curves are assumed known. For example, nonlinear or polynomial
mixed effects models can be used to parametrically model the effects of curves
on an outcome. However, a limitation of parametric approaches to curve
fitting is the requirement of strong parametric assumptions regarding the
shapes of the curves. Thus, semi- and non- parametric approaches are
standard approaches to analysing functional data. These approaches provide
more flexibility for fitting curves to data since they do not require a specific
parametric form. Additionally, their abilities to easily accommodate the high
dimensionality of functional data is
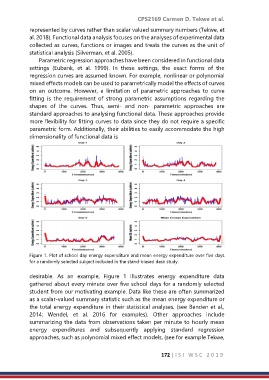
Figure 1. Plot of school day energy expenditure and mean energy expenditure over five days
for a randomly selected subject included in the stand-biased desk study.
desirable. As an example, Figure 1 illustrates energy expenditure data
gathered about every minute over five school days for a randomly selected
student from our motivating example. Data like these are often summarized
as a scalar-valued summary statistic such as the mean energy expenditure or
the total energy expenditure in their statistical analyses, (see Benden et al.,
2014; Wendel, et al. 2016 for examples). Other approaches include
summarizing the data from observations taken per minute to hourly mean
energy expenditures and subsequently applying standard regression
approaches, such as polynomial mixed effect models, (see for example Tekwe,
172 | I S I W S C 2 0 1 9