
Page 196 - Contributed Paper Session (CPS) - Volume 4
P. 196
CPS2173 Felicien Donat Edgar Towenan Accrombessy et al.
In Benin, the financing of the school is essentially the responsibility of the
State and its partners in development. However, households contribute to the
education of their children through enrollment in private schools that are
growing in urban areas.
b. Primary school performance by location: A principal components
analysis
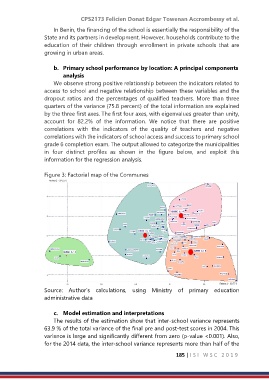
We observe strong positive relationship between the indicators related to
access to school and negative relationship between these variables and the
dropout ratios and the percentages of qualified teachers. More than three
quarters of the variance (75.8 percent) of the total information are explained
by the three first axes. The first four axes, with eigenvalues greater than unity,
account for 82.2% of the information. We notice that there are positive
correlations with the indicators of the quality of teachers and negative
correlations with the indicators of school access and success to primary school
grade 6 completion exam. The output allowed to categorize the municipalities
in four distinct profiles as shown in the figure below, and exploit this
information for the regression analysis.
Figure 3: Factorial map of the Communes
Source: Author’s calculations, using Ministry of primary education
administrative data
c. Model estimation and interpretations
The results of the estimation show that inter-school variance represents
63.9 % of the total variance of the final pre and post-test scores in 2004. This
variance is large and significantly different from zero (p-value <0.001). Also,
for the 2014 data, the inter-school variance represents more than half of the
185 | I S I W S C 2 0 1 9