
Page 203 - Contributed Paper Session (CPS) - Volume 4
P. 203
CPS2174 Septian R. et al.
2.4 Evaluation criteria
The evaluation need to be implemented to check the consistency of
prediction in each class of response variable. Because of the response variable
has binary scale, the concept of confussion matrix to calculate accuration
value, sensitifity value, and specificity value are essential to apply. Suppose a
2 × 2 table with notation based on data set [7].
Reference
Predicted KIRC (1) LUAD (0)
KIRC (1) A B
LUAD (0) C D
The formulas used here are:
+
=
+ + +
=
+
=
+
3. Result and discussion
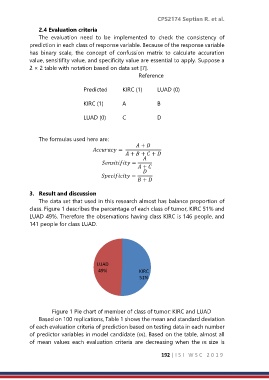
The data set that used in this research almost has balance proportion of
class. Figure 1 describes the percentage of each class of tumor, KIRC 51% and
LUAD 49%. Therefore the observations having class KIRC is 146 people, and
141 people for class LUAD.
LUAD
49% KIRC
51%
Figure 1 Pie chart of member of class of tumor: KIRC and LUAD
Based on 100 replications, Table 1 shows the mean and standard deviation
of each evaluation criteria of prediction based on testing data in each number
of predictor variables in model candidate (). Based on the table, almost all
of mean values each evaluation criteria are decreasing when the size is
192 | I S I W S C 2 0 1 9