
Page 286 - Contributed Paper Session (CPS) - Volume 4
P. 286
CPS2229 Diyana Amalina F. et al.
The sampling frame used to draw a HIS sample includes 78,976
enumeration blocks (EB) for urban and rural areas in strata 1 to strata 4 for
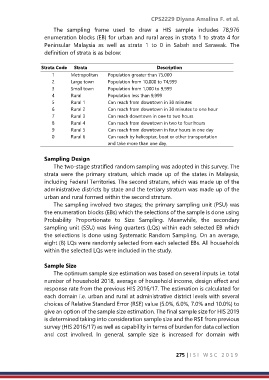
Peninsular Malaysia as well as strata 1 to 0 in Sabah and Sarawak. The
definition of strata is as below:
Strata Code Strata Description
1 Metropolitan Population greater than 75,000
2 Large town Population from 10,000 to 74,999
3 Small town Population from 1,000 to 9,999
4 Rural Population less than 9,999
5 Rural 1 Can reach from downtown in 30 minutes
6 Rural 2 Can reach from downtown in 30 minutes to one hour
7 Rural 3 Can reach downtown in one to two hours
8 Rural 4 Can reach from downtown in two to four hours
9 Rural 5 Can reach from downtown in four hours in one day
0 Rural 6 Can reach by helicopter, boat or other transportation
and take more than one day.
Sampling Design
The two-stage stratified random sampling was adopted in this survey. The
strata were the primary stratum, which made up of the states in Malaysia,
including Federal Territories. The second stratum, which was made up of the
administrative districts by state and the tertiary stratum was made up of the
urban and rural formed within the second stratum.
The sampling involved two stages; the primary sampling unit (PSU) was
the enumeration blocks (EBs) which the selections of the sample is done using
Probability Proportionate to Size Sampling. Meanwhile, the secondary
sampling unit (SSU) was living quarters (LQs) within each selected EB which
the selections is done using Systematic Random Sampling. On an average,
eight (8) LQs were randomly selected from each selected EBs. All households
within the selected LQs were included in the study.
Sample Size
The optimum sample size estimation was based on several inputs i.e. total
number of household 2018, average of household income, design effect and
response rate from the previous HIS 2016/17. The estimation is calculated for
each domain i.e. urban and rural at administrative district levels with several
choices of Relative Standard Error (RSE) value (5.0%, 6.0%, 7.0% and 10.0%) to
give an option of the sample size estimation. The final sample size for HIS 2019
is determined taking into consideration sample size and the RSE from previous
survey (HIS 2016/17) as well as capability in terms of burden for data collection
and cost involved. In general, sample size is increased for domain with
275 | I S I W S C 2 0 1 9