
Page 287 - Contributed Paper Session (CPS) - Volume 4
P. 287
CPS2229 Diyana Amalina F. et al.
considerably high RSE. In contrast, the previous sample size is maintained for
domain with low RSE. This is to ensure the reliability of the estimates produced.
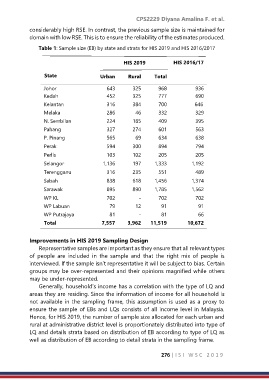
Table 1: Sample size (EB) by state and strata for HIS 2019 and HIS 2016/2017
HIS 2019 HIS 2016/17
State Urban Rural Total
Johor 643 325 968 936
Kedah 452 325 777 690
Kelantan 316 384 700 646
Melaka 286 46 332 329
N. Sembilan 224 185 409 395
Pahang 327 274 601 563
P. Pinang 565 69 634 638
Perak 594 300 894 794
Perlis 103 102 205 205
Selangor 1,136 197 1,333 1,192
Terengganu 316 235 551 489
Sabah 838 618 1,456 1,374
Sarawak 895 890 1,785 1,562
WP KL 702 - 702 702
WP Labuan 79 12 91 91
WP Putrajaya 81 - 81 66
Total 7,557 3,962 11,519 10,672
Improvements in HIS 2019 Sampling Design
Representative samples are important as they ensure that all relevant types
of people are included in the sample and that the right mix of people is
interviewed. If the sample isn’t representative it will be subject to bias. Certain
groups may be over-represented and their opinions magnified while others
may be under-represented.
Generally, household's income has a correlation with the type of LQ and
areas they are residing. Since the information of income for all household is
not available in the sampling frame, this assumption is used as a proxy to
ensure the sample of EBs and LQs consists of all income level in Malaysia.
Hence, for HIS 2019, the number of sample size allocated for each urban and
rural at administrative district level is proportionately distributed into type of
LQ and details strata based on distribution of EB according to type of LQ as
well as distribution of EB according to detail strata in the sampling frame.
276 | I S I W S C 2 0 1 9