
Page 298 - Contributed Paper Session (CPS) - Volume 4
P. 298
CPS2230 Braden P. et al.
5. Example Using a Modified Canada Shapefile
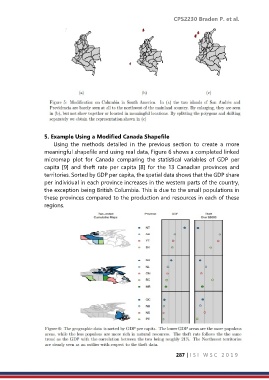
Using the methods detailed in the previous section to create a more
meaningful shapefile and using real data, Figure 6 shows a completed linked
micromap plot for Canada comparing the statistical variables of GDP per
capita [9] and theft rate per capita [8] for the 13 Canadian provinces and
territories. Sorted by GDP per capita, the spatial data shows that the GDP share
per individual in each province increases in the western parts of the country,
the exception being British Columbia. This is due to the small populations in
these provinces compared to the production and resources in each of these
regions.
287 | I S I W S C 2 0 1 9