
Page 448 - Contributed Paper Session (CPS) - Volume 4
P. 448
CPS2564 Tiffany Rizkika et al.
Table above shows the MAPE value of modelling using Distributed Lag Model
with Lag 1, NN RPROP with (2) Neuron, (3) Neuron, and (2,3) Neuron. Also with
the different period of data, daily and weekly. The minimum MAPE for DLM
model (cell with yellow highlight) is dominated by the model with weekly
period data, where 6 commodities have the model with lower MAPE value.
While the minimum MAPE value for NN RPROP model (cell with blue highlight)
also dominated with by the model with weekly period data, but in different
number of neuron.
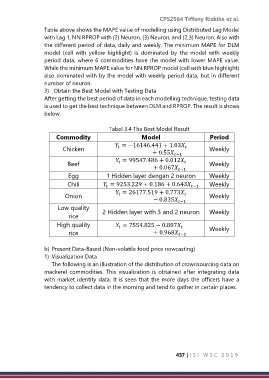
3) Obtain the Best Model with Testing Data
After getting the best period of data in each modelling technique, testing data
is used to get the best technique between DLM and RPROP. The result is shows
below.
Tabel 3.4 The Best Model Result
Commodity Model Period
Chicken = −16146.441 + 1.03 Weekly
+ 0.55 −1
Beef = 99547.486 + 0.012 Weekly
+ 0.067 −1
Egg 1 Hidden layer dengan 2 neuron Weekly
Chili = 9253.229 + 0.186 + 0.643 −1 Weekly
Onion = 26177.519 + 0.773 Weekly
− 0.835 −1
Low quality 2 Hidden layer with 3 and 2 neuron Weekly
rice
High quality = 7554.825 − 0.807 Weekly
rice + 0.968 −1
b) Present Data-Based (Non-volatile food price nowcasting)
1) Visualization Data
The following is an illustration of the distribution of crowdsourcing data on
mackerel commodities. This visualization is obtained after integrating data
with market identity data. It is seen that the more days the officers have a
tendency to collect data in the morning and tend to gather in certain places.
437 | I S I W S C 2 0 1 9