
Page 191 - Contributed Paper Session (CPS) - Volume 7
P. 191
CPS2057 Ana C. M. Ciconelle et al.
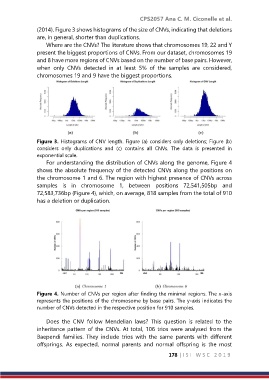
(2014). Figure 3 shows histograms of the size of CNVs, indicating that deletions
are, in general, shorter than duplications.
Where are the CNVs? The literature shows that chromosomes 19, 22 and Y
present the biggest proportions of CNVs. From our dataset, chromosomes 19
and 8 have more regions of CNVs based on the number of base pairs. However,
when only CNVs detected in at least 5% of the samples are considered,
chromosomes 19 and 9 have the biggest proportions.
Figure 3. Histograms of CNV length. Figure (a) considers only deletions; Figure (b)
considers only duplications and (c) contains all CNVs. The data is presented in
exponential scale.
For understanding the distribution of CNVs along the genome, Figure 4
shows the absolute frequency of the detected CNVs along the positions on
the chromosome 1 and 6. The region with highest presence of CNVs across
samples is in chromosome 1, between positions 72,541,505bp and
72,583,736bp (Figure 4), which, on average, 818 samples from the total of 910
has a deletion or duplication.
Figure 4. Number of CNVs per region after finding the minimal regions. The x‐axis
represents the positions of the chromosome by base pairs. The y‐axis indicates the
number of CNVs detected in the respective position for 910 samples.
Does the CNV follow Mendelian laws? This question is related to the
inheritance pattern of the CNVs. At total, 106 trios were analysed from the
Baependi families. They include trios with the same parents with different
offsprings. As expected, normal parents and normal offspring is the most
178 | I S I W S C 2 0 1 9