
Page 192 - Contributed Paper Session (CPS) - Volume 7
P. 192
CPS2057 Ana C. M. Ciconelle et al.
common combination of CNV occurrences, in which, on average, 77.45% of
the trios are all normal for all 8,794 CNVs. When we consider the case of one
parent being normal and another having a deletion, we expected, under the
Mendelian law, that the proportions of children with two copies would be
similar to the children with one deletion. However, on average, 7.52% of the
trios has parents with one normal parent and another with single deletion and
the mean frequency of the trios with offspring with deletion is 1.29%, while
with normal offspring is 6.06%. It means that, in general, the affected parent
transmits preferentially the normal allele instead of the allele with deletion. A
similar situation can be found for trios in which one of the parents is normal
and the other has one duplication.
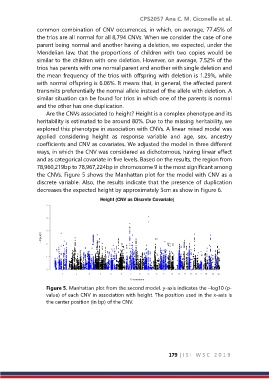
Are the CNVs associated to height? Height is a complex phenotype and its
heritability is estimated to be around 80%. Due to the missing heritability, we
explored this phenotype in association with CNVs. A linear mixed model was
applied considering height as response variable and age, sex, ancestry
coefficients and CNV as covariates. We adjusted the model in three different
ways, in which the CNV was considered as dichotomous, having linear effect
and as categorical covariate in five levels. Based on the results, the region from
78,960,219bp to 78,967,224bp in chromosome 9 is the most significant among
the CNVs. Figure 5 shows the Manhattan plot for the model with CNV as a
discrete variable. Also, the results indicate that the presence of duplication
decreases the expected height by approximately 3cm as show in Figure 6.
Figure 5. Manhattan plot from the second model. y‐axis indicates the –log10 (p‐
value) of each CNV in association with height. The position used in the x‐axis is
the center position (in bp) of the CNV.
179 | I S I W S C 2 0 1 9