
Page 189 - Contributed Paper Session (CPS) - Volume 7
P. 189
CPS2057 Ana C. M. Ciconelle et al.
positions of each SNP for each canonical genotype (AA, AB and BB). Then, the
calculation of LRR and BAF values for each SNP and each sample are made. All
these values are used by a hidden Markov model (HMM) to CNV calling for
each sample. Quality control values are also generated. The identified CNV
regions are specific for each sample (individual). We excluded the samples that
do not pass in the quality control. Then, a new set of minimal regions, defined
by the overlap regions across all samples, was built and all minimal regions
with a low frequency of CNVs (less than 2%) were removed. The final minimal
regions are then ready for the CNV analysis of this work.
The SOLAR package combined with R scripts was used to analyse the
CNVs, calculate the heritability of traits and associate CNVs and traits.
Heritability corresponds to the intraclass correlation coefficient defined under
linear mixed model formulation and considering family‐based designs.
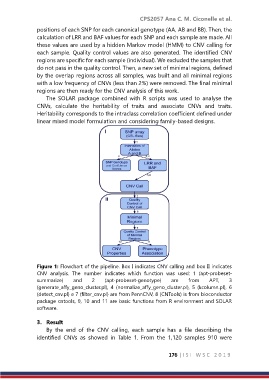
Figure 1: Flowchart of the pipeline. Box I indicates CNV calling and box II indicates
CNV analysis. The number indicates which function was used: 1 (apt‐probeset‐
summarize) and 2 (apt‐probeset‐genotype) are from APT, 3
(generate_affy_geno_cluster.pl), 4 (normalize_affy_geno_cluster.pl), 5 (kcolumn.pl), 6
(detect_cnv.pl) e 7 (filter_cnv.pl) are from PennCNV, 8 (CNTools) is from bioconductor
package cntools, 9, 10 and 11 are basic functions from R environment and SOLAR
software.
3. Result
By the end of the CNV calling, each sample has a file describing the
identified CNVs as showed in Table 1. From the 1,120 samples 910 were
176 | I S I W S C 2 0 1 9