
Page 190 - Contributed Paper Session (CPS) - Volume 7
P. 190
CPS2057 Ana C. M. Ciconelle et al.
considered for analysis due the quality control filtering. From the original data,
we were able to identify 375,312 CNVs and, after the cleaning procedure, this
value dropped to 135,414 CNVs. From these CNVs, we obtained 64,107
minimal regions, in which we considered the overlap of CNVs. Due the low
frequency of some CNVs in the samples, after filtering, only 8,794 were
considered.
How many CNVs does an individual have? For this question, the number
of CNVs we obtained from each sample varies from 17 to 2,921 CNVs. However,
we also can observe that a subgroup of 83% of the samples contains less than
100 CNVs, which is expected limit for PennCNV. For this subgroup of samples,
the mean number of CNVs per sample is 56.49 (standard deviation equal to
15). For both, the complete samples and the subgroup, the median of 60 and
57 CNVs, respectively, are compatible with similar studies. We also can observe
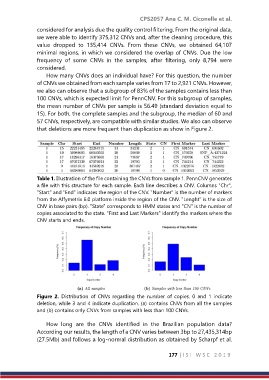
that deletions are more frequent than duplication as show in Figure 2.
Table 1. Illustration of the file containing the CNVs from sample 1. PennCNV generates
a file with this structure for each sample. Each line describes a CNV. Columns "Chr",
"Start" and "End" indicates the region of the CNV. "Number" is the number of markers
from the Affymetrix 6.0 platform inside the region of the CNV. "Lenght" is the size of
CNV in base pairs (bp). "State" corresponds to HMM states and "CN" is the number of
copies associated to the state. "First and Last Markers" identify the markers where the
CNV starts and ends.
Figure 2. Distribution of CNVs regarding the number of copies. 0 and 1 indicate
deletion, while 3 and 4 indicate duplication. (a) contains CNVs from all the samples
and (b) contains only CNVs from samples with less than 100 CNVs.
How long are the CNVs identified in the Brazilian population data?
According our results, the length of a CNV varies between 3bp to 27,435,314bp
(27.5Mb) and follows a log‐normal distribution as obtained by Scharpf et al.
177 | I S I W S C 2 0 1 9