
Page 313 - Contributed Paper Session (CPS) - Volume 7
P. 313
CPS2108 Azza Hassan
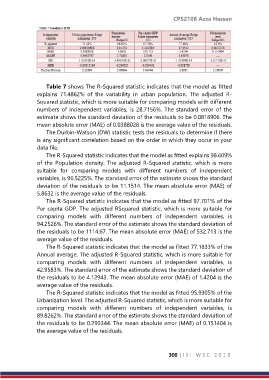
Table 7 shows The R-Squared statistic indicates that the model as fitted
explains 71.4862% of the variability in urban population. The adjusted R-
Squared statistic, which is more suitable for comparing models with different
numbers of independent variables, is 28.7156%. The standard error of the
estimate shows the standard deviation of the residuals to be 0.0818906. The
mean absolute error (MAE) of 0.0388028 is the average value of the residuals.
The Durbin-Watson (DW) statistic tests the residuals to determine if there
is any significant correlation based on the order in which they occur in your
data file.
The R-Squared statistic indicates that the model as fitted explains 98.609%
of the Population density. The adjusted R-Squared statistic, which is more
suitable for comparing models with different numbers of independent
variables, is 96.5225%. The standard error of the estimate shows the standard
deviation of the residuals to be 11.1514. The mean absolute error (MAE) of
5.8632 is the average value of the residuals.
The R-Squared statistic indicates that the model as fitted 97.701% of the
Per capita GDP. The adjusted RSquared statistic, which is more suitable for
comparing models with different numbers of independent variables, is
94.2526%. The standard error of the estimate shows the standard deviation of
the residuals to be 1114.67. The mean absolute error (MAE) of 532.713 is the
average value of the residuals.
The R-Squared statistic indicates that the model as fitted 77.1833% of the
Annual average. The adjusted R-Squared statistic, which is more suitable for
comparing models with different numbers of independent variables, is
42.9583%. The standard error of the estimate shows the standard deviation of
the residuals to be 4.12943. The mean absolute error (MAE) of 1.4204 is the
average value of the residuals.
The R-Squared statistic indicates that the model as fitted 95.9305% of the
Urbanization level. The adjusted R-Squared statistic, which is more suitable for
comparing models with different numbers of independent variables, is
89.8262%. The standard error of the estimate shows the standard deviation of
the residuals to be 0.295344. The mean absolute error (MAE) of 0.151404 is
the average value of the residuals.
300 | I S I W S C 2 0 1 9