
Page 309 - Contributed Paper Session (CPS) - Volume 7
P. 309
CPS2108 Azza Hassan
total world population, while some 3.3 billion people live in urban areas. While
nearly 180,000 people move daily in urban areas, 60 million people from non-
developed countries move annually to urban areas (urbanization is more
Developed countries). (Dociu, Dunarintu, 2012).
For the Arab Republic of Egypt, the strategy of urban development in
Egyptian cities began to develop general plans for the main cities in 1958, and
then urban planning began to take an advanced position in the late sixties by
the establishment of Greater Cairo Planning Authority, which includes Cairo
and surrounding communities. In Cairo in the identification of land use, road
networks and construction systems that took eleven years 1982, and in 1996
began to think of the development of a national strategy at the national level
by preparing an urban map of Egypt until 2017, and then began the General
Authority for Urban Planning to develop a map of the development In the
fields of agriculture, industry, water, population, transportation,
transportation, tourism and mineral wealth in order to achieve the country's
urban strategy and to move from the narrow valley to the new areas (Ibrahim,
2000).
2. Methodology
The analyses in this paper are based on data from the World Bank. Using
the Multiple regression models. The study uses four dependent variables used
to represent the development of population density and the level of
urbanization to represent urbanization, per capita GDP and average annual
wages to represent urban economic development. The variables representing
traditional economic factors, human capital development, urban facilities,
infrastructure, FDI, Governmental organizations to identify the factors most
relevant to urban development in the Arab Republic of Egypt from 2006 to
2016
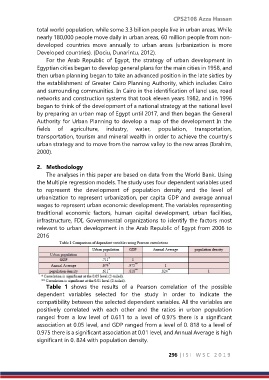
Table 1 shows the results of a Pearson correlation of the possible
dependent variables selected for the study in order to indicate the
compatibility between the selected dependent variables. All the variables are
positively correlated with each other and the ratios in urban population
ranged from a low level of 0.611 to a level of 0.975 there is a significant
association at 0.05 level, and GDP ranged from a level of 0. 818 to a level of
0.975 there is a significant association at 0.01 level, and Annual Average is high
significant in 0. 824 with population density.
296 | I S I W S C 2 0 1 9