
Page 310 - Contributed Paper Session (CPS) - Volume 7
P. 310
CPS2108 Azza Hassan
With the selection of the dependent variables, the models were
selected using the following formula:
Y = β0 + β1x1 + β2x2 + β3x3 + β4x4 + β5x5 + β6x6 + ε
Where
Y = Urban population (urban population divided by total population).
= Per capita GDP (gross domestic product divided by total population).
= Average annual pay (mean annual remuneration).
= Population density (population in units of 10,000 per square
kilometer). and
β0 = Constant.
X1 = Green space (per capita public green space in square meters).
X2 = FDI (per capita foreign direct investment in $USD).
X3 = Public transportation (per capita number of public transportation
vehicles).
X4 = Pollution (per capita industrial sulfur dioxide emissions).
X5 = Internet users.
X6 = Electric power generated from stations belonging to production
companies.
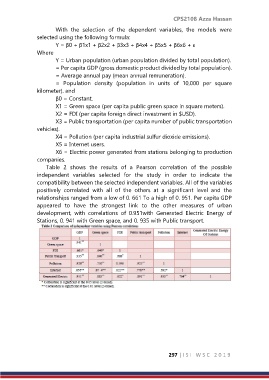
Table 2 shows the results of a Pearson correlation of the possible
independent variables selected for the study in order to indicate the
compatibility between the selected independent variables. All of the variables
positively correlated with all of the others at a significant level and the
relationships ranged from a low of 0. 661 To a high of 0. 951. Per capita GDP
appeared to have the strongest link to the other measures of urban
development, with correlations of 0.951with Generated Electric Energy of
Stations, 0. 941 with Green space, and 0. 935 with Public transport.
297 | I S I W S C 2 0 1 9