Page 48 - Contributed Paper Session (CPS) - Volume 7
P. 48

CPS2027 Olayan A. et al.
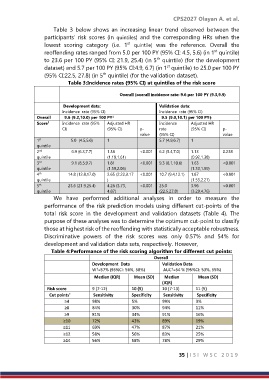
                      Table  3  below  shows  an  increasing  linear  trend  observed  between  the
                  participants’  risk  scores  (in  quintiles)  and  the  corresponding  HRs  when  the
                                                  st
                  lowest  scoring  category  (i.e.  1   quintile)  was  the  reference.  Overall  the
                                                                                   st
                  reoffending rates ranged from 5.0 per 100 PY (95% CI: 4.5, 5.6) (in 1  quintile)
                                                             th
                  to 23.6 per 100 PY (95% CI: 21.9, 25.4) (in 5  quintile) (for the development
                                                                 st
                  dataset) and 5.7 per 100 PY (95% CI:4.9, 6.7) (in 1  quintile) to 25.0 per 100 PY
                                         th
                  (95% CI:22.5, 27.8) (in 5  quintile) (for the validation dataset).
                           Table 3:Incidence rates (95% CI) at quintiles of the risk score

                                                                           Overall (overall incidence rate: 9.6 per 100 PY (9.3,9.9)

                          Development data:                   Validation data:
                         Incidence  rate (95% CI)             Incidence  rate (95% CI)
               Overall      9.6 (9.2,10.0) per 100 PY           9.5 (9.0,10.1) per 100 PYǂ
                                            ǂ
               Score     Incidence  rate (95%   Adjusted HR      Incidence    Adjusted HR
                   1
                         CI)              (95% CI)     p-     rate        (95% CI)     p-
                                                       value   (95% CI)                value
               1            5.0  (4.5,5.6)   1                5.7 (4.9,6.7)   1
                st
               quintile
               2            6.9 (6.3,7.7)   1.38       <0.001   6.2 (5.4,7.0)   1.13   0.238
                nd
               quintile                   (1.19,1.61)                     (0.92,1.38)
               3            9.1 (8.5,9.7)   1.81       <0.001   9.3 (8.1,10.6)   1.63   <0.001
                rd
               quintile                   (1.59,2.06)                     (1.33,1.99)
               4           14.8 (12.8,17.0)   2.65 (2.22,3.17   <0.001   10.7 (9.4,12.1)   1.87   <0.001
                th
               quintile                   )                               (1.53,2.27)
               5           23.6 (21.9,25.4)   4.26 (3.73,   <0.001   25.0   3.96       <0.001
                th
               quintile                   4.87)               (22.5,27.8)   (3.29,4.76)
                      We  have  performed  additional  analyses  in  order  to  measure  the
                  performance of the risk prediction models using different cut-points of the
                  total  risk  score  in  the  development  and  validation  datasets  (Table  4).  The
                  purpose of these analyses was to determine the optimum cut-point to classify
                  those at highest risk of the reoffending with statistically acceptable robustness.
                  Discriminative  powers  of  the  risk  scores  was  only  0.57%  and  54%  for
                  development and validation data sets, respectively. However,
                     Table 4:Performance of the risk scoring algorithm for different cut points:
                                                            Overall
                                    Development  Data          Validation Data
                                    W =57% (95%CI: 56%, 58%)    AUC =54 % (95%CI: 53%, 55%)
                                      ǂ
                                                                   ǂ
                                      Median (IQR)     Mean (SD)     Median     Mean (SD)
                                                               (IQR)
                   Risk score       9 (7-12)        10 (5)     10 (7-13)    11 (5)
                     Cut points †     Sensitivity    Specificity    Sensitivity     Specificity
                          ≥4        98%             5%         99%          3%
                          ≥8        84%             30%        94%          11%
                          ≥9        81%             34%        91%          16%
                         ≥10        72%             43%        89%          19%
                         ≥11        69%             47%        87%          21%
                         ≥12        58%             56%        83%          25%
                         ≥14        56%             58%        78%          29%

                                                                      35 | I S I   W S C   2 0 1 9
   43   44   45   46   47   48   49   50   51   52   53