
Page 201 - Contributed Paper Session (CPS) - Volume 6
P. 201
CPS1881 Mike S.C. et al.
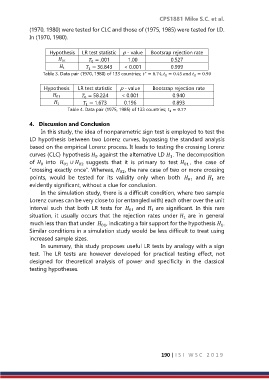
(1970, 1980) were tested for CLC and those of (1975, 1985) were tested for LD.
In (1970, 1980).
Hypothesis LR test statistic p - value Bootsrap rejection rate
= .001 1.00 0.527
01
0
= 36.843 < 0.001 0.999
1
1
∗
Table 3. Data pair (1970, 1980) of 133 countries; = 0.74, 1 = 0.45 2 = 0.90
Hypothesis LR test statistic p - value Bootsrap rejection rate
= 58.224 < 0.001 0.940
01
0
= 1.673 0.196 0.893
1
1
Table 4. Data pair (1975, 1985) of 133 countries; 1 = 0.77
4. Discussion and Conclusion
In this study, the idea of nonparametric sign test is employed to test the
LD hypothesis between two Lorenz curves, bypassing the standard analysis
based on the empirical Lorenz process. It leads to testing the crossing Lorenz
curves (CLC) hypothesis against the alternative LD . The decomposition
0
1
of into 01 ∪ suggests that it is primary to test , the case of
02
0
01
“crossing exactly once”. Whereas, , the rare case of two or more crossing
02
points, would be tested for its validity only when both 01 and are
1
evidently significant, without a clue for conclusion.
In the simulation study, there is a difficult condition, where two sample
Lorenz curves can be very close to (or entangled with) each other over the unit
interval such that both LR tests for and are significant. In this rare
1
01
situation, it usually occurs that the rejection rates under are in general
1
much less than that under , indicating a fair support for the hypothesis .
1
01
Similar conditions in a simulation study would be less difficult to treat using
increased sample sizes.
In summary, this study proposes useful LR tests by analogy with a sign
test. The LR tests are however developed for practical testing effect, not
designed for theoretical analysis of power and specificity in the classical
testing hypotheses.
190 | I S I W S C 2 0 1 9