Page 200 - Contributed Paper Session (CPS) - Volume 6
P. 200

CPS1881 Mike S.C. et al.
                                     1000                         250       0.047     1.000
                                     1000                         1000      0.000     1.000
                   Weibull (1.0, 1.2)   250   Lognormal (0, 1.0)   250      0.265     0.992
                                      250                         1000      0.167     0.994
                                     1000                         250       0.127     1.000
                                     1000                         1000      0.005     1.000
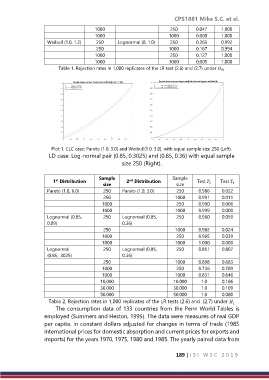
                        Table 1. Rejection rates in 1,000 replicates of the LR test (2.6) and (2.7) under  01


                     Plot 1. CLC case: Pareto (1.0, 3.0) and Weibull(1.0, 3.0), with equal sample size 250 (Left).
                    LD case: Log-normal pair (0.85, 0.3025) and (0.85, 0.36) with equal sample
                                                size 250 (Right).

                                       Sample                      Sample
                                                   nd
                      st
                     1  Distribution              2  Distribution            Test  0    Test  1
                                         size                        size
                   Pareto (1.0, 6.0)     250    Pareto (1.0, 3.0)    250     0.986    0.022
                                         250                        1000     0.991    0.011
                                        1000                         250     0.990    0.006
                                        1000                        1000     0.999    0.000
                   Lognormal (0.85,      250    Lognormal (0.85,     250     0.960    0.059
                   0.09)                        0.36)
                                         250                        1000     0.982    0.024
                                        1000                         250     0.965    0.039
                                        1000                        1000     1.000    0.000
                   Lognormal             250    Lognormal (0.85,     250     0.851    0.807
                   (0.85, .3025)                0.36)
                                         250                        1000     0.898    0.683
                                        1000                         250     0.736    0.789
                                        1000                        1000     0.831    0.646
                                        10,000                      10.000    1.0     0.186
                                        30.000                      30.000    1.0     0.109
                                        50.000                      50.000    1.0     0.080
                    Table 2. Rejection rates in 1,000 replicates of the LR tests (2.6) and  (2.7) under 
                                                                                          1
                      The consumption data of 133 countries from the Penn World Tables is
                  employed (Summers and Heston, 1995). The data were measures of real GDP
                  per capita, in constant dollars adjusted for changes in terms of trade (1985
                  international prices for domestic absorption and current prices for exports and
                  imports) for the years 1970, 1975, 1980 and 1985. The yearly paired data from


                                                                     189 | I S I   W S C   2 0 1 9
   195   196   197   198   199   200   201   202   203   204   205