
Page 199 - Contributed Paper Session (CPS) - Volume 6
P. 199
CPS1881 Mike S.C. et al.
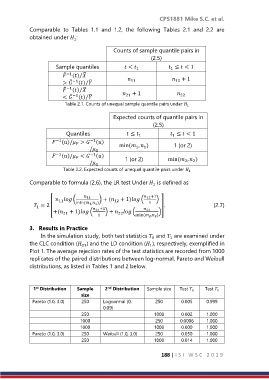
Comparable to Tables 1.1 and 1.2, the following Tables 2.1 and 2.2 are
obtained under :
1
Counts of sample quantile pairs in
(2.5)
Sample quantiles < ≤ < 1
1
1
̅
⁄
̂ −1 () + 1
̅
̂ −1
⁄
> () 11 12
̅
⁄
̂ −1 () + 1
̅
̂ −1
⁄
< () 21 22
Table 2.1. Counts of unequal sample quantile pairs under 1
Expected counts of quantile pairs in
(2.5)
Quantiles ≤ ≤ < 1
1
1
−1 ()/ > −1 () min ( , ) 1 (or 2)
/ 1 1
−1 ()/ < −1 () 1 (or 2) min ( , )
/ 2 2
Table 2.2. Expected counts of unequal quantile pairs under 1
Comparable to formula (2.6), the LR test Under is defined as
1
( 11 ) + ( 12 + 1) ( 12 +1 )
11
= 2 [ min ( 1, 1 ) 1 ]. (2.7)
1
22
+( 21 + 1) ( 21 +1 ) + ( min ( 2 , 2 ) )
22
1
3. Results in Practice
In the simulation study, both test statistics and are examined under
1
0
the CLC condition ( ) and the LD condition ( ), respectively, exemplified in
1
01
Plot 1. The average rejection rates of the test statistics are recorded from 1000
replicates of the paired distributions between log-normal, Pareto and Weibull
distributions, as listed in Tables 1 and 2 below.
1 Distribution Sample 2 Distribution Sample size Test 0 Test 1
st
nd
size
Pareto (1.0, 3.0) 250 Lognormal (0, 250 0.005 0.999
0.09)
250 1000 0.002 1.000
1000 250 0.0006 1.000
1000 1000 0.000 1.000
Pareto (1.0, 3.0) 250 Weibull (1.0, 3.0) 250 0.050 1.000
250 1000 0.014 1.000
188 | I S I W S C 2 0 1 9