
Page 237 - Contributed Paper Session (CPS) - Volume 6
P. 237
CPS1907 Klaudia M. T. et al.
The analysis of correlations of gross value added in 63-61 industry and
each physical indicator, we detected the following overlapped structure of
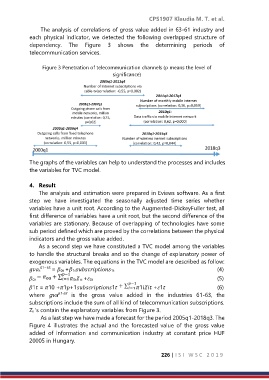
dependency. The Figure 3 shows the determining periods of
telecommunication services.
Figure 3 Penetration of telecommunication channels (p means the level of
significance)
The graphs of the variables can help to understand the processes and includes
the variables for TVC model.
4. Result
The analysis and estimation were prepared in Eviews software. As a first
step we have investigated the seasonally adjusted time series whether
variables have a unit root. According to the Augmented-DickeyFuller test, all
first difference of variables have a unit root, but the second difference of the
variables are stationary. Because of overlapping of technologies have some
sub period defined which are proved by the correlations between the physical
indicators and the gross value added.
As a second step we have constituted a TVC model among the variables
to handle the structural breaks and so the change of explanatory power of
exogenous variables. The equations in the TVC model are described as follow:
61−63 = 0 +11 (4)
0 0 +0 (5)
1 = 10 +1+11 1 +1 (6)
where gva 61-63 is the gross value added in the industries 61-63, the
subscriptions include the sum of all kind of telecommunication subscriptions.
Zi ‘s contain the explanatory variables from Figure 3.
As a last step we have made a forecast for the period 2005q1-2018q3. The
Figure 4 illustrates the actual and the forecasted value of the gross value
added of information and communication industry at constant price HUF
20005 in Hungary.
226 | I S I W S C 2 0 1 9