
Page 234 - Contributed Paper Session (CPS) - Volume 6
P. 234
CPS1907 Klaudia M. T. et al.
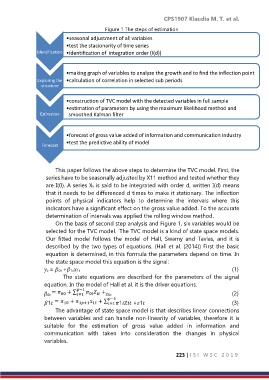
Figure 1 The steps of estimation
• seasonal adjustment of all variables
• test the stacionarity of time series
Identification • identification of integration order (I(d))
• making graph of variables to analyze the growth and to find the inflection point
Exploring the • calculation of correlation in selected sub periods
structure
• construction of TVC model with the detected variables in full sample
• estimat ion of parameters by using the maximum likelihood method and
Estimation smoothed Kalman filter
• forecast of gross value added of information and communication industry
• test the predictive ability of model
Forecast
This paper follows the above steps to determine the TVC model. First, the
series have to be seasonally adjusted by X11 method and tested whether they
are I(0). A series Xt is said to be integrated with order d, written I(d) means
that it needs to be differenced d times to make it stationary. The inflection
points of physical indicators help to determine the intervals where this
indicators have a significant effect on the gross value added. To the accurate
determination of intervals was applied the rolling window method.
On the basis of second step analysis and Figure 1, six variables would be
selected for the TVC model. The TVC model is a kind of state space models.
Our fitted model follows the model of Hall, Swamy and Tavlas, and it is
described by the two types of equations. (Hall et al. (2014)) First the basic
equation is determined, in this formula the parameters depend on time. In
the state space model this equation is the signal:
= 0 +11 (1)
The state equations are described for the parameters of the signal
equation. In the model of Hall et al. it is the driver equations.
0 0 (2)
1 1 +1 (3)
The advantage of state space model is that describes linear connections
between variables and can handle non-linearity of variables, therefore it is
suitable for the estimation of gross value added in information and
communication with taken into consideration the changes in physical
variables.
223 | I S I W S C 2 0 1 9