
Page 247 - Contributed Paper Session (CPS) - Volume 6
P. 247
CPS1908 Klára A. T. et al.
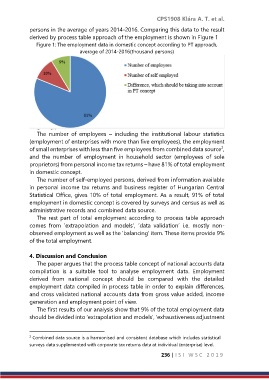
persons in the average of years 2014-2016. Comparing this data to the result
derived by process table approach of the employment is shown in Figure 1
Figure 1: The employment data in domestic concept according to PT approach,
average of 2014-2016(thousand persons)
The number of employees – including the institutional labour statistics
(employment of enterprises with more than five employees), the employment
of small enterprises with less than five employees from combined data source ,
2
and the number of employment in household sector (employees of sole
proprietors) from personal income tax returns – have 81% of total employment
in domestic concept.
The number of self-employed persons, derived from information available
in personal income tax returns and business register of Hungarian Central
Statistical Office, gives 10% of total employment. As a result, 91% of total
employment in domestic concept is covered by surveys and census as well as
administrative records and combined data source.
The rest part of total employment according to process table approach
comes from ‘extrapolation and models’, ‘data validation’ i.e. mostly non-
observed employment as well as the ‘balancing’ item. These items provide 9%
of the total employment.
4. Discussion and Conclusion
The paper argues that the process table concept of national accounts data
compilation is a suitable tool to analyse employment data. Employment
derived from national concept should be compared with the detailed
employment data compiled in process table in order to explain differences,
and cross validated national accounts data from gross value added, income
generation and employment point of view.
The first results of our analysis show that 9% of the total employment data
should be divided into ‘extrapolation and models’, ‘exhaustiveness adjustment
2 Combined data source is a harmonised and consistent database which includes statistical
surveys data supplemented with corporate tax returns data at individual (enterprise) level.
236 | I S I W S C 2 0 1 9