
Page 318 - Contributed Paper Session (CPS) - Volume 6
P. 318
CPS1939 Josefina V. A. et al.
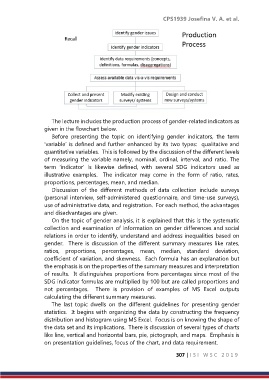
The lecture includes the production process of gender-related indicators as
given in the flowchart below.
Before presenting the topic on identifying gender indicators, the term
‘variable’ is defined and further enhanced by its two types: qualitative and
quantitative variables. This is followed by the discussion of the different levels
of measuring the variable namely, nominal, ordinal, interval, and ratio. The
term ‘indicator’ is likewise defined, with several SDG indicators used as
illustrative examples. The indicator may come in the form of ratio, rates,
proportions, percentages, mean, and median.
Discussion of the different methods of data collection include surveys
(personal interview, self-administered questionnaire, and time-use surveys),
use of administrative data, and registration. For each method, the advantages
and disadvantages are given.
On the topic of gender analysis, it is explained that this is the systematic
collection and examination of information on gender differences and social
relations in order to identify, understand and address inequalities based on
gender. There is discussion of the different summary measures like rates,
ratios, proportions, percentages, mean, median, standard deviation,
coefficient of variation, and skewness. Each formula has an explanation but
the emphasis is on the properties of the summary measures and interpretation
of results. It distinguishes proportions from percentages since most of the
SDG indicator formulas are multiplied by 100 but are called proportions and
not percentages. There is provision of examples of MS Excel outputs
calculating the different summary measures.
The last topic dwells on the different guidelines for presenting gender
statistics. It begins with organizing the data by constructing the frequency
distribution and histogram using MS Excel. Focus is on knowing the shape of
the data set and its implications. There is discussion of several types of charts
like line, vertical and horizontal bars, pie, pictograph, and maps. Emphasis is
on presentation guidelines, focus of the chart, and data requirement.
307 | I S I W S C 2 0 1 9