
Page 362 - Contributed Paper Session (CPS) - Volume 6
P. 362
CPS1966 Jessa L. S. C. et al.
the second model. Both are within the threshold of 20%. However, since the
latter has a smaller misclassification, this was considered the final model.
From the significant coefficients above, it can be interpreted that Unit-
linked is preferred over Other Traditional if the amount of life insurance
coverage shifts from between P1,500,000 and P2,000,000 to below P1,000,000.
This indicates that aside from Unit-linked which was discussed earlier, Other
Traditional is also preferred by clients who are interested in getting large
protection coverage. However, it can also be seen that Other Traditional is
preferred over Unit-linked if the income shifts from above P150,000 to below
P50,000 which means that Other Traditional is the preference for the segment
with lower income but would like to have a larger protection. This is reasonable
since under Other Traditional falls Term Products which offer large insurance
coverage at a lower cost than Unit-linked.
Another insight is that Unit-linked is preferred over Endowment if the
income shifts to between P50,000 and P150,000 from above P150,000; and
Unit-linked is preferred over Endowment if the insured is same as owner. These
two when combined matches the insight from CART that clients that earn
around P95,000 or higher prefers to purchase Unit-linked plans for himself.
For Random Forest, the estimated error rate for each of the combinations
of mtry and M was computed for the validation data of the splits. The total
misclassification rates are 12.45%, and 13.40% respectively. Since the full
model has lower total misclassification, this was considered as the final model
for Random Forest.
Unlike CART, Random Forest does not generate a structure that represents
the relationship between the predictors. Instead, insights on the model are
produced from the influence of the variable to the prediction. The importance
of a variable is determined by the change in impurity in the prediction. This
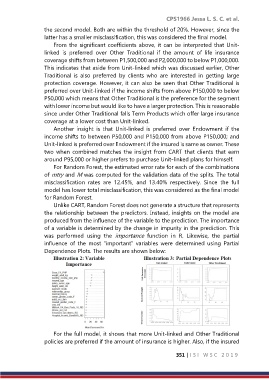
was performed using the importance function in R. Likewise, the partial
influence of the most “important” variables were determined using Partial
Dependence Plots. The results are shown below:
For the full model, it shows that more Unit-linked and Other Traditional
policies are preferred if the amount of insurance is higher. Also, if the insured
351 | I S I W S C 2 0 1 9