
Page 174 - Invited Paper Session (IPS) - Volume 1
P. 174
IPS129 Rivera-Galicia, L.F. et al.
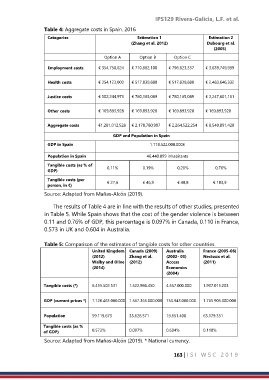
Table 4: Aggregate costs in Spain. 2016
Categories Estimation 1 Estimation 2
(Zhang et al. 2012) Dubourg et al.
(2005)
Option A Option B Option C
Employment costs € 354,750,624 € 710,882,100 € 796,623,357 € 3,639,749,999
Health costs € 254,123,003 € 517,839,880 € 517,839,880 € 2,483,646,332
Justice costs € 502,244,973 € 780,165,089 € 780,165,089 € 2,247,601,161
Other costs € 169,893,928 € 169,893,928 € 169,893,928 € 169,893,928
Aggregate costs €1,281,012,528 € 2,178,780,997 € 2,264,522,254 € 8,540,891,420
GDP and Population in Spain
GDP in Spain 1.118.522.000.000€
Population in Spain 46.440.099 inhabitants
Tangible costs (as % of 0,11% 0,19% 0,20% 0,76%
GDP)
Tangible costs (per € 27,6 € 46,9 € 48,8 € 183,9
person, in €)
Source: Adapted from Mañas-Alcón (2019).
The results of Table 4 are in line with the results of other studies, presented
in Table 5. While Spain shows that the cost of the gender violence is between
0.11 and 0.76% of GDP, this percentage is 0.097% in Canada, 0.110 in France,
0.573 in UK and 0.604 in Australia.
Table 5: Comparison of the estimates of tangible costs for other countries.
United Kingdom Canada (2009) Australia France (2005-06)
(2012) Zhang et al. (2002- 03) Nectoux et al.
Walby and Olive (2012) Access (2011)
(2014) Economics
(2004)
Tangible costs (*) 6.455.502.531 1.522.986.450 4.557.000.000 1.937.015.203
GDP (current prices *) 1.126.463.000.000 1.567.365.000.000 753.943.000.000 1.765.905.000.000
Population 59.119.673 33.628.571 19.651.400 63.179.351
Tangible costs (as %
of GDP) 0.573% 0.097% 0.604% 0.110%
Source: Adapted from Mañas-Alcón (2019). * National currency.
163 | I S I W S C 2 0 1 9