
Page 256 - Invited Paper Session (IPS) - Volume 1
P. 256
IPS152 Ryan N.
investment abroad would decrease overall owner’s equity in MOFAs from
$12.9 trillion to $6.4 trillion. Equity in subsidiaries would decline from $7.9
trillion to $1.4 trillion. Reflecting the close connection between pass-through
equity and SPEs, 81 percent of all pass-through equity moved through SPEs.
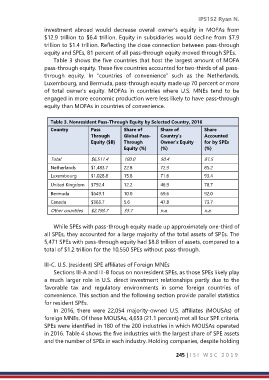
Table 3 shows the five countries that host the largest amount of MOFA
pass-through equity. These five countries accounted for two-thirds of all pass-
through equity. In “countries of convenience” such as the Netherlands,
Luxembourg, and Bermuda, pass-through equity made up 70 percent or more
of total owner’s equity. MOFAs in countries where U.S. MNEs tend to be
engaged in more economic production were less likely to have pass-through
equity than MOFAs in countries of convenience.
Table 3. Nonresident Pass-Through Equity by Selected Country, 2016
Country Pass Share of Share of Share
Through Global Pass- Country’s Accounted
Equity ($B) Through Owner’s Equity for by SPEs
Equity (%) (%) (%)
Total $6,511.4 100.0 50.4 81.5
Netherlands $1,483.7 22.8 72.9 85.2
Luxembourg $1,028.8 15.8 71.6 93.4
United Kingdom $792.4 12.2 46.9 78.7
Bermuda $649.1 10.0 69.6 92.0
Canada $363.7 5.6 47.8 73.7
Other countries $2,193.7 33.7 n.a. n.a.
While SPEs with pass-through equity made up approximately one-third of
all SPEs, they accounted for a large majority of the total assets of SPEs. The
5,471 SPEs with pass-through equity had $8.8 trillion of assets, compared to a
total of $1.2 trillion for the 10,550 SPEs without pass-through.
III-C. U.S. (resident) SPE affiliates of Foreign MNEs
Sections III-A and III-B focus on nonresident SPEs, as those SPEs likely play
a much larger role in U.S. direct investment relationships partly due to the
favorable tax and regulatory environments in some foreign countries of
convenience. This section and the following section provide parallel statistics
for resident SPEs.
In 2016, there were 22,054 majority-owned U.S. affiliates (MOUSAs) of
foreign MNEs. Of these MOUSAs, 4,653 (21.1 percent) met all four SPE criteria.
SPEs were identified in 180 of the 200 industries in which MOUSAs operated
in 2016. Table 4 shows the five industries with the largest share of SPE assets
and the number of SPEs in each industry. Holding companies, despite holding
245 | I S I W S C 2 0 1 9