
Page 258 - Invited Paper Session (IPS) - Volume 1
P. 258
IPS152 Ryan N.
III-D. Pass-through in U.S. (resident) affiliates of foreign MNEs
In 2016, pass-through equity in MOUSAs of foreign MNEs totaled $613
billion. This represented less than 10 percent of the value of pass-through
found in MOFAs of U.S. MNEs, indicating that pass-through activity is more
common for U.S. outward direct investment than for U.S. inward direct invest-
ment. Pass-through equity made up 24 percent of owner’s equity in MOUSAs,
compared with 50 percent of owner’s equity in MOFAs. Pass-through equity
accounted for 80 percent of MOUSA equity in subsidiaries, similar to the 83
percent observed for MOFAs. Subtracting $613 billion from BEA’s inward
statistics on foreign direct investment in the United States would decrease
owner’s equity in MOUSAs from $2.5 trillion to $1.9 trillion, while equity in
subsidiaries would decline from $762 billion to $149 billion.
Another important difference between pass-through in MOUSAs and
MOFAs is that MOUSA pass-through equity is much more distributed across
SPEs and non-SPEs. While 82 percent of MOFA pass-through moves through
SPEs, that figure is only 17 percent for MOUSAs.
10
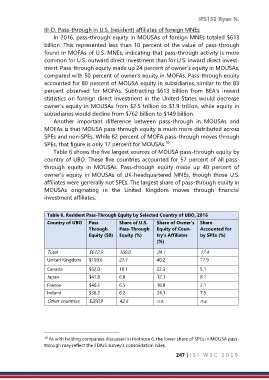
Table 6 shows the five largest sources of MOUSA pass-through equity by
country of UBO. These five countries accounted for 57 percent of all pass-
through equity in MOUSAs. Pass-through equity made up 40 percent of
owner’s equity in MOUSAs of UK-headquartered MNEs, though those U.S.
affiliates were generally not SPEs. The largest share of pass-through equity in
MOUSAs originating in the United Kingdom moves through financial
investment affiliates.
Table 6. Resident Pass-Through Equity by Selected Country of UBO, 2016
Country of UBO Pass Share of U.S. Share of Owner’s Share
Through Pass-Through Equity of Coun- Accounted for
Equity ($B) Equity (%) try’s Affiliates by SPEs (%)
(%)
Total $612.5 100.0 24.1 17.4
United Kingdom $169.6 27.7 40.2 17.9
Canada $62.0 10.1 22.3 5.1
Japan $41.8 6.8 12.1 8.1
France $40.5 6.5 18.8 2.1
Ireland $38.3 6.2 24.1 7.5
Other countries $260.9 42.6 n.a. n.a.
As with holding companies discussed in footnote 6, the lower share of SPEs in MOUSA pass-
10
through may reflect the FDIUS survey’s consolidation rules.
247 | I S I W S C 2 0 1 9