
Page 255 - Invited Paper Session (IPS) - Volume 1
P. 255
IPS152 Ryan N.
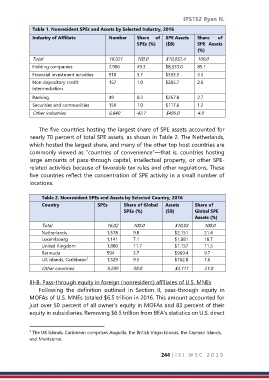
Table 1. Nonresident SPEs and Assets by Selected Industry, 2016
Industry of Affiliate Number Share of SPE Assets Share of
SPEs (%) ($B) SPE Assets
(%)
Total 16,021 100.0 $10,032.4 100.0
Holding companies 7,906 49.3 $8,533.0 85.1
Financial investment activities 910 5.7 $333.3 3.3
Non-depository credit 157 1.0 $285.7 2.8
intermediation
Banking 49 0.3 $267.8 2.7
Securities and commodities 159 1.0 $117.6 1.2
Other industries 6,840 42.7 $495.0 4.9
The five countries hosting the largest share of SPE assets accounted for
nearly 70 percent of total SPE assets, as shown in Table 2. The Netherlands,
which hosted the largest share, and many of the other top host countries are
commonly viewed as “countries of convenience”—that is, countries hosting
large amounts of pass-through capital, intellectual property, or other SPE-
related activities because of favorable tax rules and other regulations. These
five countries reflect the concentration of SPE activity in a small number of
locations.
Table 2. Nonresident SPEs and Assets by Selected Country, 2016
Country SPEs Share of Global Assets Share of
SPEs (%) ($B) Global SPE
Assets (%)
Total 16,02 100.0 $10,03 100.0
Netherlands 1 1,578 9.8 2.4 $2,151 21.4
Luxembourg 1,141 7.1 .0 $1,881 18.7
United Kingdom 1,880 11.7 .0 $1,157 11.5
Bermuda 594 3.7 .0 $969.4 9.7
UK Islands, Caribbean 1,529 9.5 $762.8 7.6
7
Other countries 9,299 58.0 $3,111 31.0
.3
III-B. Pass-through equity in foreign (nonresident) affiliates of U.S. MNEs
Following the definition outlined in Section II, pass-through equity in
MOFAs of U.S. MNEs totaled $6.5 trillion in 2016. This amount accounted for
just over 50 percent of all owner’s equity in MOFAs and 83 percent of their
equity in subsidiaries. Removing $6.5 trillion from BEA’s statistics on U.S. direct
7 The UK Islands, Caribbean comprises Anguilla, the British Virgin Islands, the Cayman Islands,
and Montserrat.
244 | I S I W S C 2 0 1 9