
Page 264 - Invited Paper Session (IPS) - Volume 1
P. 264
IPS129 Claudia V. et al.
3. Result
High level results
Utilising the definition developed by the TFSPE and data sources available
at the time of analysis, this paper estimates that £74 billion, or 8.4%, of the
UK’s inward FDI position in 2016 was attributable to SPEs.
As shown in Table 1, the UK’s inward FDI position was £1,200 billion in
2016, of which £323 billion related to entities that did not have employment
and turnover data available at the time of analysis – see previous section for
more information on why.
Over two-thirds of the groups in the FDI population were matched to the
IDBR, who in turn accounted for £877 billion of UK inward FDI in 2016. Of
these, £82 billion of inward FDI positions were held by groups with five or
fewer employees, which fell to £74 billion when the threshold of £1 million was
applied.
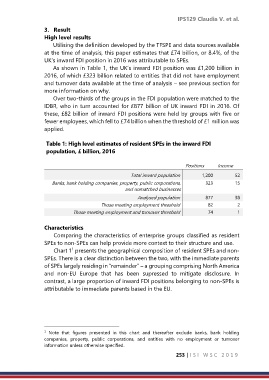
Table 1: High level estimates of resident SPEs in the inward FDI
population, £ billion, 2016
Positions Income
Total inward population 1,200 52
Banks, bank holding companies, property, public corporations, 323 15
and unmatched businesses
Analysed population 877 38
Those meeting employment threshold 82 2
Those meeting employment and turnover threshold 74 1
Characteristics
Comparing the characteristics of enterprise groups classified as resident
SPEs to non-SPEs can help provide more context to their structure and use.
Chart 1 presents the geographical composition of resident SPEs and non-
1
SPEs. There is a clear distinction between the two, with the immediate parents
of SPEs largely residing in “remainder” – a grouping comprising North America
and non-EU Europe that has been supressed to mitigate disclosure. In
contrast, a large proportion of inward FDI positions belonging to non-SPEs is
attributable to immediate parents based in the EU.
Note that figures presented in this chart and thereafter exclude banks, bank holding
1
companies, property, public corporations, and entities with no employment or turnover
information unless otherwise specified.
253 | I S I W S C 2 0 1 9