
Page 265 - Invited Paper Session (IPS) - Volume 1
P. 265
IPS129 Claudia V. et al.
Chart 1: Geographical composition of resident SPEs and non-SPEs, 2016
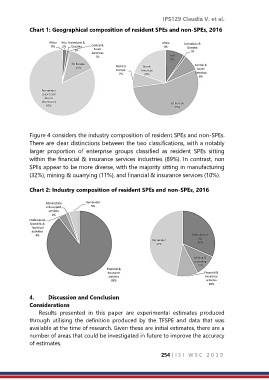
Figure 4 considers the industry composition of resident SPEs and non-SPEs.
There are clear distinctions between the two classifications, with a notably
larger proportion of enterprise groups classified as resident SPEs sitting
within the financial & insurance services industries (89%). In contrast, non
SPEs appear to be more diverse, with the majority sitting in manufacturing
(32%), mining & quarrying (11%), and financial & insurance services (10%).
Chart 2: Industry composition of resident SPEs and non-SPEs, 2016
4. Discussion and Conclusion
Considerations
Results presented in this paper are experimental estimates produced
through utilising the definition produced by the TFSPE and data that was
available at the time of research. Given these are initial estimates, there are a
number of areas that could be investigated in future to improve the accuracy
of estimates.
254 | I S I W S C 2 0 1 9