
Page 102 - Invited Paper Session (IPS) - Volume 2
P. 102
IPS184 Celestino G. et al.
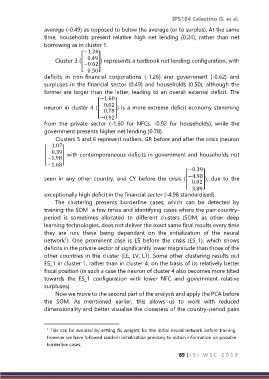
average (-0.49) as opposed to below the average (or to surplus). At the same
time, households present relative high net lending (0.24), rather than net
borrowing as in cluster 1.
−1.26
Cluster 3 ([ 0.49 ]) represents a textbook net lending configuration, with
−0.62
0.50
deficits in non-financial corporations (-1.26) and government (-0.62) and
surpluses in the financial sector (0.49) and households (0.50), although the
former are larger than the latter, leading to an overall external deficit. The
−1.60
0.02
neuron in cluster 4 ([ ]) is a more extreme deficit economy stemming
0.78
−0.92
from the private sector (-1.60 for NFCs, -0.92 for households), while the
government presents higher net lending (0.78).
Clusters 5 and 6 represent outliers, GR before and after the crisis (neuron
1.07
[ 0.39 ] with contemporaneous deficits in government and households not
−1.98
−1.68
−0.39
seen in any other country, and CY before the crisis ([ −4.98 ]), due to the
0.02
3.89
exceptionally high deficit in the financial sector (-4.98 standardised).
The clustering presents borderline cases, which can be detected by
training the SOM a few times and identifying cases where the pair country-
period is sometimes allocated to different clusters (SOM, as other deep
learning technologies, does not deliver the exact same final results every time
they are run, these being dependant on the initialization of the neural
network ). One prominent case is ES before the crisis (ES_1), which shows
7
deficits in the private sector of significantly lower magnitude than those of the
other countries in the cluster (EE, LV, LT). Some other clustering results put
ES_1 in cluster 1, rather than in cluster 4, on the basis of its relatively better
fiscal position (in such a case the neuron of cluster 4 also becomes more tilted
towards the ES_1 configuration with lower NFC and government relative
surpluses).
Now we move to the second part of the analysis and apply the PCA before
the SOM. As mentioned earlier, this allows us to work with reduced
dimensionality and better visualise the closeness of the country-period pairs
7 This can be avoided by setting fix weights for the initial neural network before training.
However we have followed random initialization precisely to obtain information on possible
borderline cases.
89 | I S I W S C 2 0 1 9