
Page 104 - Invited Paper Session (IPS) - Volume 2
P. 104
IPS184 Celestino G. et al.
of the clusters on the basis of the net lending of NFCs (S11) and government
(S13) to help follow the changes undergone in domestic imbalances by the
countries in transition.
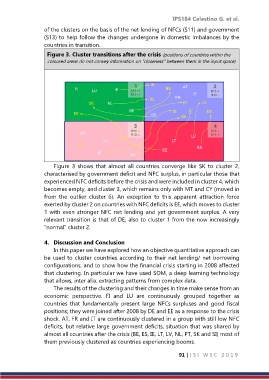
Figure 3. Cluster transitions after the crisis (positions of countries within the
coloured areas do not convey information on “closeness” between them in the input space)
Figure 3 shows that almost all countries converge like SK to cluster 2,
characterised by government deficit and NFC surplus, in particular those that
experienced NFC deficits before the crisis and were included in cluster 4, which
becomes empty, and cluster 3, which remains only with MT and CY (moved in
from the outlier cluster 6). An exception to this apparent attraction force
exerted by cluster 2 on countries with NFC deficits is EE, which moves to cluster
1 with even stronger NFC net lending and yet government surplus. A very
relevant transition is that of DE, also to cluster 1 from the now increasingly
“normal” cluster 2.
4. Discussion and Conclusion
In this paper we have explored how an objective quantitative approach can
be used to cluster countries according to their net lending/ net borrowing
configurations, and to show how the financial crisis starting in 2008 affected
that clustering. In particular we have used SOM, a deep learning technology
that allows, inter alia, extracting patterns from complex data.
The results of the clustering and their changes in time make sense from an
economic perspective. FI and LU are continuously grouped together as
countries that fundamentally present large NFCs surpluses and good fiscal
positions; they were joined after 2008 by DE and EE as a response to the crisis
shock. AT, FR and IT are continuously clustered in a group with still low NFC
deficits, but relative large government deficits, situation that was shared by
almost all countries after the crisis (BE, ES, IE, LT, LV, NL, PT, SK and SI) most of
them previously clustered as countries experiencing booms.
91 | I S I W S C 2 0 1 9