
Page 103 - Invited Paper Session (IPS) - Volume 2
P. 103
IPS184 Celestino G. et al.
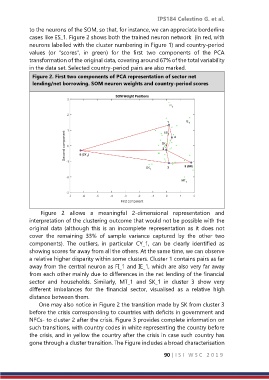
to the neurons of the SOM, so that, for instance, we can appreciate borderline
cases like ES_1. Figure 2 shows both the trained neuron network (in red, with
neurons labelled with the cluster numbering in Figure 1) and country-period
values (or “scores”, in green) for the first two components of the PCA
transformation of the original data, covering around 67% of the total variability
in the data set. Selected country-period pairs are also marked.
Figure 2. First two components of PCA representation of sector net
lending/net borrowing. SOM neuron weights and country-period scores
Figure 2 allows a meaningful 2-dimensional representation and
interpretation of the clustering outcome that would not be possible with the
original data (although this is an incomplete representation as it does not
cover the remaining 33% of sample variance captured by the other two
components). The outliers, in particular CY_1, can be clearly identified as
showing scores far away from all the others. At the same time, we can observe
a relative higher disparity within some clusters. Cluster 1 contains pairs as far
away from the central neuron as FI_1 and IE_1, which are also very far away
from each other mainly due to differences in the net lending of the financial
sector and households. Similarly, MT_1 and SK_1 in cluster 3 show very
different imbalances for the financial sector, visualised as a relative high
distance between them.
One may also notice in Figure 2 the transition made by SK from cluster 3
before the crisis corresponding to countries with deficits in government and
NFCs- to cluster 2 after the crisis. Figure 3 provides complete information on
such transitions, with country codes in white representing the country before
the crisis, and in yellow the country after the crisis in case such country has
gone through a cluster transition. The Figure includes a broad characterisation
90 | I S I W S C 2 0 1 9