Page 101 - Invited Paper Session (IPS) - Volume 2
P. 101

IPS184 Celestino G. et al.
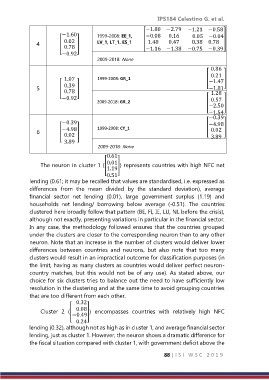
                                                         −1.80 −2.79     −1.21 −0.58
                         −1.60        1999-2008: EE_1,   [ −0.08  0.16       0.05 −0.04 ]

               4        [  0.02  ]    LV_1, LT_1, ES_1    1.48    0.47     0.38 0.78
                          0.78                           −1.16 −1.38     −0.75 −0.39
                         −0.92
                                      2009-2018: None

                                                                                  0.86
                                                                                  0.21
                          1.07        1999-2008: GR_1                                                                          [
                                                                                       ]
                                                                                 −1.47
               5        [  0.39  ]                                               −1.81
                          0.78                                                    1.28
                         −0.92                                                    0.57
                                      2009-2018: GR_2
                                                                                [
                                                                                       ]
                                                                                 −2.50
                                                                                 −1.54
                                                                                 −0.39
                         −0.39                                                   −4.98
                                                                                [
                                                                                       ]
                                                                                  0.02
               6        [ −4.98 ]     1999-2008: CY_1

                          0.02
                                                                                  3.89
                          3.89
                                       2009-2018: None

                                          0.61
                 The neuron in cluster 1 ([ 0.01 ]) represents countries with high NFC net
                                          1.19
                                          0.51
            lending (0.61; it may be recalled that values are standardised, i.e. expressed as
            differences  from  the  mean  divided  by  the  standard  deviation),  average
            financial  sector  net  lending  (0.01),  large  government  surplus  (1.19)  and
            households  net  lending/  borrowing  below  average  (-0.51).  The  countries
            clustered here broadly follow that pattern (BE, FI, IE, LU, NL before the crisis),
            although not exactly, presenting variations in particular in the financial sector.
            In any case, the methodology followed ensures that the countries grouped
            under the clusters are closer to the corresponding neuron than to any other
            neuron. Note that an increase in the number of clusters would deliver lower
            differences  between  countries  and  neurons,  but  also  note  that  too  many
            clusters would result in an impractical outcome for classification purposes (in
            the limit, having as many clusters as countries would deliver perfect neuron-
            country  matches,  but  this  would  not  be  of  any  use).  As  stated  above,  our
            choice for six clusters tries to balance out the need to have sufficiently low
            resolution in the clustering and at the same time to avoid grouping countries
            that are too different from each other.
                                0.32
                 Cluster  2  ([    0.08 ])  encompasses  countries  with  relatively  high  NFC
                             −0.49
                                0.24
            lending (0.32), although not as high as in cluster 1, and average financial sector
            lending, just as cluster 1. However, the neuron shows a dramatic difference for
            the fiscal situation compared with cluster 1, with government deficit above the

                                                                88 | I S I   W S C   2 0 1 9
   96   97   98   99   100   101   102   103   104   105   106