Page 100 - Invited Paper Session (IPS) - Volume 2
P. 100

IPS184 Celestino G. et al.
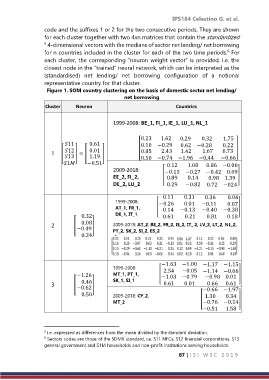
                  code and the suffixes 1 or 2 for the two consecutive periods. They are shown
                  for each cluster together with two 4xn matrices that contain the standardized
                  5  4-dimensional vectors with the medians of sector net lending/ net borrowing
                                                                                        6
                  for n countries included in the cluster for each of the two time periods.  For
                  each cluster, the corresponding “neuron weight vector” is provided, i.e. the
                  closest node in the “trained” neural network, which can be interpreted as the
                  (standardised)  net  lending/  net  borrowing  configuration  of  a  notional
                  representative country for that cluster.
                   Figure 1. SOM country clustering on the basis of domestic sector net lending/
                                                 net borrowing

                  Cluster     Neuron                                 Countries


                                            1999-2008: BE_1, FI_1, IE_1, LU_1, NL_1

                                                       0.23     1.62  0.29     0.32     1.75
                          11     0.61               [ 0.10 −0.29    0.62 −0.28     0.22   ]
                     1  [ 12 ] = [  0.01  ]          0.85      2.43  1.42     1.67    0.73
                          13
                                   1.19
                                                       0.50 −0.74 −1.96 −0.44  −0.66
                          1    −0.51                         0.12    1.08   0.86 −0.06
                                            2009-2018:          −0.15 −0.27 −0.42 0.09
                                            EE_2, FI_2,        [  0.89   0.14    0.98 1.39  ]
                                            DE_2, LU_2           0.29   −0.82   0.72 −024
                                                                 0.11     0.31     0.36      0.06
                                             1999-2008:       −0.26      0.01  −0.11     0.07
                                                                                 [  0.14  −0.13  −0.40  −0.38 ]
                                             AT_1, FR_1,

                                  0.32       DE_1, IT_1                                    0.21      0.81     0.18
                                                                0.61
                     2       [     0.08 ]      2009-2018: AT_2, BE_2, FR_2, IE_2, IT_ 2, LV_2, LT_2, NL_2,
                              −0.49          PT_2, SK_2, SI_2, ES_2
                                  0.24


                                                               −1.63 −1.00 −1.17 −1.15
                                            1999-2008:          2.54   −0.05 −1.14 −0.06
                              −1.26         MT_1, PT_1,        [ −1.03 −0.79    −0.98 0.01   ]
                     3       [     0.46 ]   SK_1, SI_1          0.61    0.01    0.66    0.61
                              −0.62
                                  0.50      2009-2018: CY_2,                   −0.66 −1.97
                                                                                        0.34
                                                                                1.30
                                            MT_2                              [ −0.76 −0.14  ]
                                                                               −0.51    1.58


                  5  i.e. expressed as differences from the mean divided by the standard deviation.
                    Sectors codes are those of the SDMX standard, i.e. S11 NFCs, S12 financial corporations, S13
                  6
                  general government and S1M households and non-profit institutions serving households.
                                                                      87 | I S I   W S C   2 0 1 9
   95   96   97   98   99   100   101   102   103   104   105