
Page 145 - Invited Paper Session (IPS) - Volume 2
P. 145
IPS192 Hukum C. et al.
case, the SNLEP performs best, with low bias and is more efficient than the EP.
As expected, these results improve as the sample size increases.
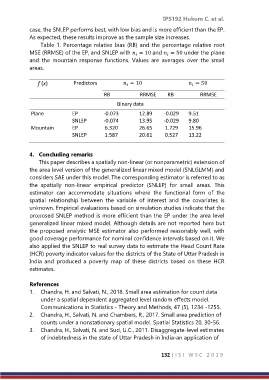
Table 1. Percentage relative bias (RB) and the percentage relative root
MSE (RRMSE) of the EP, and SNLEP with = 10 and = 50 under the plane
and the mountain response functions. Values are averages over the small
areas.
f (x) Predictors = 10 = 50
RB RRMSE RB RRMSE
Binary data
Plane EP -0.073 12.89 -0.029 9.51
SNLEP -0.074 13.95 -0.029 9.80
Mountain EP 6.320 26.65 1.729 15.96
SNLEP 1.587 20.61 0.527 13.22
4. Concluding remarks
This paper describes a spatially non-linear (or nonparametric) extension of
the area level version of the generalized linear mixed model (SNLGLMM) and
considers SAE under this model. The corresponding estimator is referred to as
the spatially non-linear empirical predictor (SNLEP) for small areas. This
estimator can accommodate situations where the functional form of the
spatial relationship between the variable of interest and the covariates is
unknown. Empirical evaluations based on simulation studies indicate that the
proposed SNLEP method is more efficient than the EP under the area level
generalized linear mixed model. Although details are not reported here but
the proposed analytic MSE estimator also performed reasonably well, with
good coverage performance for nominal confidence intervals based on it. We
also applied the SNLEP to real survey data to estimate the Head Count Rate
(HCR) poverty indicator values for the districts of the State of Uttar Pradesh in
India and produced a poverty map of these districts based on these HCR
estimates.
References
1. Chandra, H. and Salvati, N., 2018. Small area estimation for count data
under a spatial dependent aggregated level random effects model.
Communications in Statistics - Theory and Methods, 47 (5), 1234 -1255.
2. Chandra, H., Salvati, N. and Chambers, R., 2017. Small area prediction of
counts under a nonstationary spatial model. Spatial Statistics 20, 30-56.
3. Chandra, H., Salvati, N. and Sud, U.C., 2011. Disaggregate-level estimates
of indebtedness in the state of Uttar Pradesh in India-an application of
132 | I S I W S C 2 0 1 9