
Page 366 - Invited Paper Session (IPS) - Volume 2
P. 366
IPS279 Rense Lange
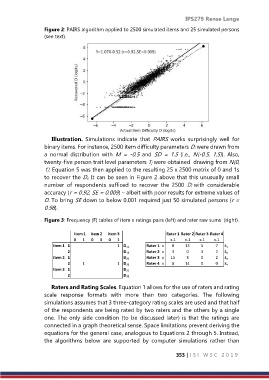
Figure 2: PAIRS algorithm applied to 2500 simulated items and 25 simulated persons
(see text).
Illustration. Simulations indicate that PAIRS works surprisingly well for
binary items. For instance, 2500 item difficulty parameters Di were drawn from
a normal distribution with M = -0.5 and SD = 1.5 (i.e., N(-0.5, 1.5)). Also,
twenty-five person trait level parameters Tj were obtained drawing from N(0,
1). Equation 5 was then applied to the resulting 25 x 2500 matrix of 0 and 1s
to recover the Di. It can be seen in Figure 2 above that this unusually small
number of respondents sufficed to recover the 2500 Di with considerable
accuracy (r = 0.92, SE = 0.009) – albeit with poor results for extreme values of
D. To bring SE down to below 0.001 required just 50 simulated persons (r =
0.98).
Figure 3: Frequency (F) tables of item x ratings pairs (left) and rater raw sums (right).
Item 1 Item 2 Item 3 Rater 1 Rater 2 Rater 3 Rater 4
0 1 0 1 0 1 x-1 x-1 x-1 x-1
Item 1 1 1 D 11 Rater 1 x 0 13 5 7 S 1
2 D 12 Rater 2 x 3 0 3 2 S 2
Item 2 1 D 21 Rater 3 x 15 3 0 2 S 3
2 1 1 D 22 Rater 4 x 8 14 0 0 S 4
Item 3 1 D 31
2 D 32
Raters and Rating Scales. Equation 1 allows for the use of raters and rating
scale response formats with more than two categories. The following
simulations assumes that 3 three-category rating scales are used and that half
of the respondents are being rated by two raters and the others by a single
one. The only side condition (to be discussed later) is that the ratings are
connected in a graph theoretical sense. Space limitations prevent deriving the
equations for the general case, analogous to Equations 2 through 5. Instead,
the algorithms below are supported by computer simulations rather than
353 | I S I W S C 2 0 1 9