
Page 368 - Invited Paper Session (IPS) - Volume 2
P. 368
IPS279 Rense Lange
different processors thereby decreasing computation time.
The parameters’ SE can be obtained via bootstrapping (at least of 25
samples are required [8])
Updating the person and rater frequency matrices (see Figure 3) shares
no computational steps. To save execution time, these updates can
thus be done simultaneously using parallel processing.
The computation of the items’ difficulty parameters proceeds
analogously, and yield Di1= Di+F1, Di2 = Di+F2 as row means (not
shown). The convention that S Di = 0 identifies the Di and the Fw.
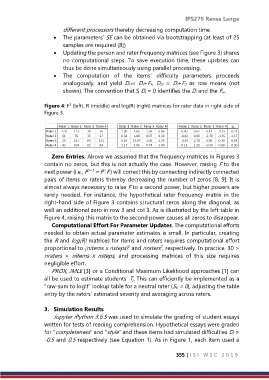
Figure 4: F (left), R (middle) and log(R) (right) matrices for rater data in right-side of
2
Figure 3.
Zero Entries. Above we assumed that the frequency matrices in Figures 3
contain no zeros, but this is not actually the case. However, raising F to the
p
next power (i.e., F p+1 = F .F ) will correct this by connecting indirectly connected
pairs of items or raters thereby decreasing the number of zeros [8, 9]. It is
almost always necessary to raise F to a second power, but higher powers are
rarely needed. For instance, the hypothetical rater frequency matrix in the
right-hand side of Figure 3 contains structural zeros along the diagonal, as
well an additional zero in row 3 and col 3. As is illustrated by the left table in
Figure 4, raising this matrix to the second power causes all zeros to disappear.
Computational Effort For Parameter Updates. The computational efforts
needed to obtain actual parameter estimates is small. In particular, creating
the R and log(R) matrices for items and raters requires computational effort
2
2
proportional to (nitems x nsteps) and nraters , respectively. In practice, 30 >
nraters > nitems x nsteps, and processing matrices of this size requires
negligible effort.
PROX, JMLE [3] or a Conditional Maximum Likelihood approaches [1] can
all be used to estimate students’ Tj. This can efficiently be implemented as a
“raw-sum to logit” lookup table for a neutral rater (Sk = 0), adjusting the table
entry by the raters’ estimated severity and averaging across raters.
3. Simulation Results
Jupyter iPython 3.6.5 was used to simulate the grading of student essays
written for tests of reading comprehension. Hypothetical essays were graded
for “completeness” and “style” and these items had simulated difficulties Di =
-0.5 and 0.5 respectively (see Equation 1). As in Figure 1, each item used a
355 | I S I W S C 2 0 1 9