
Page 369 - Invited Paper Session (IPS) - Volume 2
P. 369
IPS279 Rense Lange
three-category rating-scale (e.g., “insufficient,” “intermediate,” and
“sufficient”) with step values Fw = {-1.1, 1.1}. There are a total of five graders
available to grade the essay answers of 10,000 test takers.
The graders’ severity parameters Sk were drawn from N(0,0.25), which
agrees with values obtained in actual large-scale grading applications [6]. The
reading abilities of 10,000 students (Tj), were drawn from N(0.25, 1.1). Half of
the students were graded twice, the others once. Assignment of graders to
students was random, except raters occurred equally often. While all
“students” contribute to the item and steps calibrations, the rater severity
estimates depend solely on the students that are graded twice.
Parameter Recovery. As was the case for binary items, the difficulty
parameters and step-values could be recovered admirably, with the Root
Mean Square Error (RMSE) equal to 0.04 – even after just 100 students had
been graded. Items’ step values likewise were recovered accurately (RMSE =
0.02). Although this work has not yet been completed, the accurate recovery
of D and F implies that the JMLE recovery of the person parameters T promises
to be accurate as well. For efficiency, estimating T should be combined with
the computation of diagnostic and quality-control information.
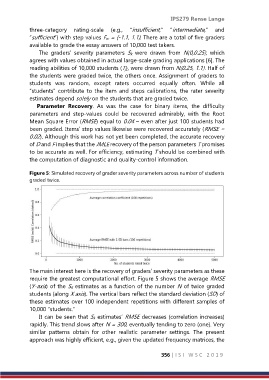
Figure 5: Simulated recovery of grader severity parameters across number of students
graded twice.
The main interest here is the recovery of graders’ severity parameters as these
require the greatest computational effort. Figure 5 shows the average RMSE
(Y-axis) of the Sk estimates as a function of the number N of twice graded
students (along X axis). The vertical bars reflect the standard deviation (SD) of
these estimates over 100 independent repetitions with different samples of
10,000 “students.”
It can be seen that Sk estimates’ RMSE decreases (correlation increases)
rapidly. This trend slows after N = 300, eventually tending to zero (one). Very
similar patterns obtain for other realistic parameter settings. The present
approach was highly efficient, e.g., given the updated frequency matrices, the
356 | I S I W S C 2 0 1 9