
Page 379 - Invited Paper Session (IPS) - Volume 2
P. 379
IPS280 VEUN, Thy et al.
4. Conclusion
The results suggest that further stratification within the province (in this
case, five strata were stratified within the province) greatly reduce the sample
size requirements for those provinces as well as the whole country. Among the
three methods of the stratum boundary determination, LHK provided the
boundaries with the smallest sample size requirement, whereas the
boundaries of GGH requires the largest sample size. Only the sample sizes at
the required levels of three and five-percent CVs are considered feasible in
practice since it is too costly to consider the sample sizes produced by one-
percent CVs. In the estimation of rates for the common and the less common
characteristics such as employment rate and adult literacy rate with the
proportion as low as 40%, both the LHK and CDH methods at the required
level of five-percent CV are acceptable in terms of both cost and precision.
One can choose the CDH method if precision is more important than cost. The
sets of sample under the CDH method generally exhibit higher precision in the
estimation than those under the LHK method, but with larger sample size than
those of the LHK method. If the survey variables are highly correlated with the
number of households in each village, the sampling designs that have been
proposed in this study can be considered. For multipurpose household survey,
such as the CSES, multivariate stratification shall be incorporated through the
application of multi-stratification variables in the further stratification within
the provinces if such variables are available for all elements in the studied
population. Use different variables for the stratification variable and the size
measure if such variables are available for all elements in the studied
population to ensure the appropriate gain from these survey techniques.
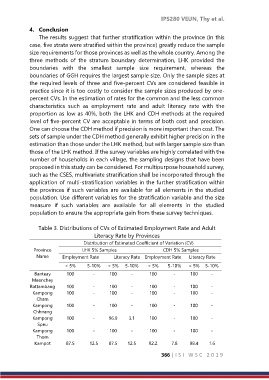
Table 3. Distributions of CVs of Estimated Employment Rate and Adult
Literacy Rate by Provinces
Distribution of Estimated Coefficient of Variation (CV)
Province LHK 5% Samples CDH 5% Samples
Name Employment Rate Literacy Rate Employment Rate Literacy Rate
< 5% 5-10% < 5% 5-10% < 5% 5-10% < 5% 5-10%
Banteay 100 - 100 - 100 - 100 -
Meanchey
Battambang 100 - 100 - 100 - 100 -
Kampong 100 - 100 - 100 - 100 -
Cham
Kampong 100 - 100 - 100 - 100 -
Chhnang
Kampong 100 - 96.9 3.1 100 - 100 -
Speu
Kampong 100 - 100 - 100 - 100 -
Thom
Kampot 87.5 12.5 87.5 12.5 92.2 7.8 98.4 1.6
366 | I S I W S C 2 0 1 9