
Page 380 - Invited Paper Session (IPS) - Volume 2
P. 380
IPS280 VEUN, Thy et al.
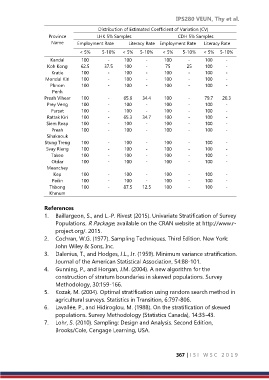
Distribution of Estimated Coefficient of Variation (CV)
Province LHK 5% Samples CDH 5% Samples
Name Employment Rate Literacy Rate Employment Rate Literacy Rate
< 5% 5-10% < 5% 5-10% < 5% 5-10% < 5% 5-10%
Kandal 100 - 100 - 100 - 100 -
Koh Kong 62.5 37.5 100 - 75 25 100 -
Kratie 100 - 100 - 100 - 100 -
Mondul Kiri 100 - 100 - 100 - 100 -
Phnom 100 - 100 - 100 - 100 -
Penh
Preah Vihear 100 - 65.6 34.4 100 - 79.7 20.3
Prey Veng 100 - 100 - 100 - 100 -
Pursat 100 - 100 - 100 - 100 -
Rattak Kiri 100 - 65.3 34.7 100 - 100 -
Siem Reap 100 - 100 - 100 - 100 -
Preah 100 - 100 - 100 - 100 -
Sihaknouk
Stung Treng 100 - 100 - 100 - 100 -
Svay Rieng 100 - 100 - 100 - 100 -
Takeo 100 - 100 - 100 - 100 -
Otdar 100 - 100 - 100 - 100 -
Meanchey
Kep 100 - 100 - 100 - 100 -
Pailin 100 - 100 - 100 - 100 -
Thbong 100 - 87.5 12.5 100 - 100 -
Khmum
References
1. Baillargeon, S., and L.-P. Rivest (2015). Univariate Stratification of Survey
Populations. R Package, available on the CRAN website at http://www.r-
project.org/. 2015.
2. Cochran, W.G. (1977). Sampling Techniques. Third Edition. New York:
John Wiley & Sons, Inc.
3. Dalenius, T., and Hodges, J.L., Jr. (1959). Minimum variance stratification.
Journal of the American Statistical Association, 54:88-101.
4. Gunning, P., and Horgan, J.M. (2004). A new algorithm for the
construction of stratum boundaries in skewed populations. Survey
Methodology, 30:159-166.
5. Kozak, M. (2004). Optimal stratification using random search method in
agricultural surveys. Statistics in Transition, 6:797-806.
6. Lavallée, P., and Hidiroglou, M. (1988). On the stratification of skewed
populations. Survey Methodology (Statistics Canada), 14:33-43.
7. Lohr, S. (2010). Sampling: Design and Analysis. Second Edition,
Brooks/Cole, Cengage Learning, USA.
367 | I S I W S C 2 0 1 9