
Page 382 - Invited Paper Session (IPS) - Volume 2
P. 382
IPS280 Erniel B. Barrios et al.
specially since it also uses a lengthy questionnaire with very complicated
response structure. In the last survey round (2015), sample size that can
generate reliable estimates up to regional level is 45,000 households. With
similar design, to generate provincial level estimates would require 180,000
households to be visited every semester.
This paper uses the 2015 FIES data in simulating a partially rotated sample to
evaluate a proposed model-assisted estimation procedure that combines
panel data and data from independent samples to generate estimates at
provincial level with desirable efficiency level.
2. Methodology
Implementing panel and independent samples combination
This paper will make use of rotated samples (partly independent, partly
panel) in a repetitive survey (2 rounds). This method uses a combination of
panel data and independent samples, i.e., part of the original samples from
the first round are visited again in the second round of the survey. Rotating
samples has been used as a sampling strategy when estimates are produced
regularly over time. In this method, equal-sized sets of sample units are
brought in and out of the sample in a specified pattern. Partially rotated
samples are intended to reduce variance of estimators, reduce the survey costs
associated with completely independent samples, and minimize respondent’s
fatigue and refusals in a panel survey.
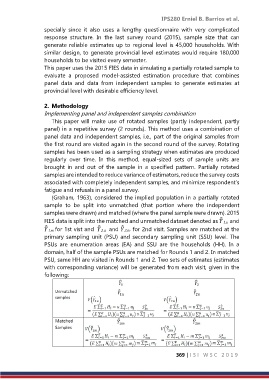
(Graham, 1963), considered the implied population in a partially rotated
sample to be split into unmatched (that portion where the independent
samples were drawn) and matched (where the panel sample were drawn). 2015
̅ ̂
FIES data is split into the matched and unmatched dataset denoted as 1,u and
̅ ̂
̅ ̂
̅ ̂
1,m for 1st vist and 2,u and 2,m for 2nd visit. Samples are matched at the
primary sampling unit (PSU) and secondary sampling unit (SSU) level. The
PSUs are enumeration areas (EA) and SSU are the households (HH). In a
domain, half of the sample PSUs are matched for Rounds 1 and 2. In matched
PSU, same HH are visited in Rounds 1 and 2. Two sets of estimates (estimates
with corresponding variance) will be generated from each visit, given in the
following:
369 | I S I W S C 2 0 1 9