Page 383 - Invited Paper Session (IPS) - Volume 2
P. 383
IPS280 Erniel B. Barrios et al.
               where  E=  total  number  of  PSUs;  e  –  number  of  sample  PSUs;  -  total
            number of HH in   PSU; ℎ – total number of sample households in   sample
                                                                              ℎ
                              ℎ
            PSU, and;  – measurement of indicator for   sample household in   sample
                                                        ℎ
                                                                              ℎ
            PSU.
               Modelling
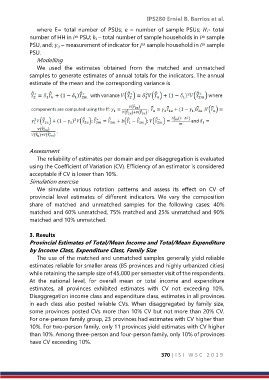
               We  used  the  estimates  obtained  from  the  matched  and  unmatched
            samples to generate estimates of annual totals for the indicators. The annual
            estimate of the mean and the corresponding variance is


            Assessment
               The reliability of estimates per domain and per disaggregation is evaluated
            using the Coefficient of Variation (CV). Efficiency of an estimator is considered
            acceptable if CV is lower than 10%.
            Simulation exercise
               We  simulate  various  rotation  patterns  and  assess  its  effect  on  CV  of
            provincial  level  estimates  of  different  indicators.  We  vary  the  composition
            share  of  matched  and  unmatched  samples  for  the  following  cases:  40%
            matched and 60% unmatched, 75% matched and 25% unmatched and 90%
            matched and 10% unmatched.

            3. Results
            Provincial Estimates of Total/Mean Income and Total/Mean Expenditure
            by Income Class, Expenditure Class, Family Size
               The use of the matched and unmatched samples generally yield reliable
            estimates reliable for smaller areas (85 provinces and highly urbanized cities)
            while retaining the sample size of 45,000 per semester visit of the respondents.
            At  the  national  level,  for  overall  mean  or  total  income  and  expenditure
            estimates,  all  provinces  exhibited  estimates  with  CV  not  exceeding  10%.
            Disaggregation income class and expenditure class, estimates in all provinces
            in each class also posted reliable CVs. When disaggregated by family size,
            some provinces posted CVs more than 10% CV but not more than 20% CV.
            For one-person family group, 23 provinces had estimates with CV higher than
            10%. For two-person family, only 11 provinces yield estimates with CV higher
            than 10%. Among three-person and four-person family, only 10% of provinces
            have CV exceeding 10%.

                                                               370 | I S I   W S C   2 0 1 9

