Page 384 - Invited Paper Session (IPS) - Volume 2
P. 384

IPS280 Erniel B. Barrios et al.
                     The  FIES  is  the  main  source  of  details  of  expenditure  used  in  poverty
                  analysis  and  updating  of  consumer  price  index.  Disaggregation  to  major
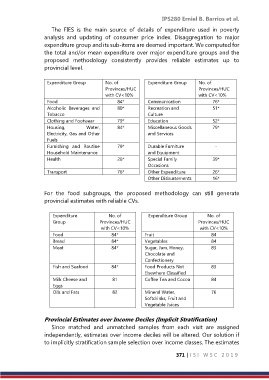
                  expenditure group and its sub-items are deemed important. We computed for
                  the total and/or mean expenditure over major expenditure groups and the
                  proposed  methodology  consistently  provides  reliable  estimates  up  to
                  provincial level.

                   Expenditure Group     No. of           Expenditure Group   No. of
                                         Provinces/HUC                       Provinces/HUC
                                         with CV<10%                         with CV<10%
                   Food                       84*         Communication            76*
                   Alcoholic  Beverages  and   80*        Recreation and           51*
                   Tobacco                                Culture
                   Clothing and Footwear      79*         Education                52*
                   Housing,       Water,      84*         Miscellaneous Goods      79*
                   Electricity, Gas and Other             and Services
                   Fuels
                   Furnishing  and  Routine   79*         Durable Furniture         -
                   Household Maintenance                  and Equipment
                   Health                     26*         Special Family           39*
                                                          Occasions
                   Transport                  76*         Other Expenditure        26*
                                                          Other Disbursements      16*

                  For  the  food  subgroups,  the  proposed  methodology  can  still  generate
                  provincial estimates with reliable CVs.

                     Expenditure           No. of         Expenditure Group      No. of
                     Group             Provinces/HUC                         Provinces/HUC
                                        with CV<10%                           with CV<10%
                     Food                   84*          Fruit                    84
                     Bread                  84*          Vegetables               84
                     Meat                   84*          Sugar, Jam, Honey,       83
                                                         Chocolate and
                                                         Confectionery
                     Fish and Seafood       84*          Food Products Not        83
                                                         Elsewhere Classified
                     Milk Cheese and        81           Coffee Tea and Cocoa     84
                     Eggs
                     Oils and Fats          82           Mineral Water,           76
                                                         Softdrinks, Fruit and
                                                         Vegetable Juices

                  Provincial Estimates over Income Deciles (Implicit Stratification)
                     Since  matched  and  unmatched  samples  from  each  visit  are  assigned
                  independently, estimates over income deciles will be altered. Our solution if
                  to implicitly stratification sample selection over income classes. The estimates

                                                                     371 | I S I   W S C   2 0 1 9
   379   380   381   382   383   384   385   386   387   388   389