
Page 430 - Invited Paper Session (IPS) - Volume 2
P. 430
IPS307 Tjeerd Jellema et al.
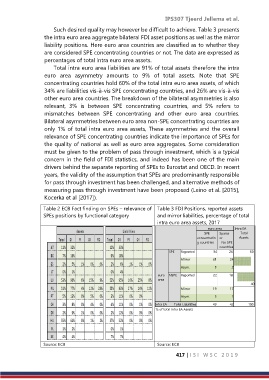
Such desired quality may however be difficult to achieve. Table 3 presents
the intra euro area aggregate bilateral FDI asset positions as well as the mirror
liability positions. Here euro area countries are classified as to whether they
are considered SPE concentrating countries or not. The data are expressed as
percentages of total intra euro area assets.
Total intra euro area liabilities are 91% of total assets therefore the intra
euro area asymmetry amounts to 9% of total assets. Note that SPE
concentrating countries hold 60% of the total intra euro area assets, of which
34% are liabilities vis-à-vis SPE concentrating countries, and 26% are vis-à-vis
other euro area countries. The breakdown of the bilateral asymmetries is also
relevant, 3% is between SPE concentrating countries, and 5% refers to
mismatches between SPE concentrating and other euro area countries.
Bilateral asymmetries between euro area non-SPE concentrating countries are
only 1% of total intra euro area assets, These asymmetries and the overall
relevance of SPE concentrating countries indicate the importance of SPEs for
the quality of national as well as euro area aggregates. Some consideration
must be given to the problem of pass through investment, which is a typical
concern in the field of FDI statistics, and indeed has been one of the main
drivers behind the separate reporting of SPEs to Eurostat and OECD. In recent
years, the validity of the assumption that SPEs are predominantly responsible
for pass through investment has been challenged, and alternative methods of
measuring pass through investment have been proposed (Leino et al. [2015],
Kocerka et al [2017]).
Table 2 ECB Fact finding on SPEs – relevance of Table 3 FDI Positions, reported assets
SPEs positions by functional category and mirror liabilities, percentage of total
intra euro area assets, 2017
euro area Intra EA
Total
SPE Sparse
concentratin or Assets
g countries countries
No SPE
SPE Reported 34 26 60
Mirror 31 24
Asym. 3 2
euro NSPE Reported 22 18
area 40
Mirror 19 17
Asym. 3 1
Intra EA Total Liabilities 49 42 100
% of total intra EA Assets
Source: ECB Source: ECB
417 | I S I W S C 2 0 1 9