
Page 429 - Invited Paper Session (IPS) - Volume 2
P. 429
IPS307 Tjeerd Jellema et al.
incentives to seek to generate corporate income in those countries where their
tax liability would be minimised. The OECD tax database [OECD2019b]
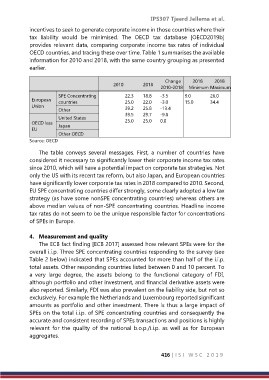
provides relevant data, comparing corporate income tax rates of individual
OECD countries, and tracing these over time. Table 1 summarises the available
information for 2010 and 2018, with the same country grouping as presented
earlier.
Change 2018 2018
2010 2018
2010-2018 Minimum Maximum
SPE Concentrating 22.3 18.8 -3.5 9.0 26.0
European countries 25.0 22.0 -3.0 15.0 34.4
Union
Other 39.2 25.8 -13.4
United States 39.5 29.7 -9.8
OECD less Japan 25.0 25.0 0.0
EU
Other OECD
Source: OECD
The table conveys several messages. First, a number of countries have
considered it necessary to significantly lower their corporate income tax rates
since 2010, which will have a potential impact on corporate tax strategies. Not
only the US with its recent tax reform, but also Japan, and European countries
have significantly lower corporate tax rates in 2018 compared to 2010. Second,
EU SPE concentrating countries differ strongly, some clearly adopted a low tax
strategy (as have some nonSPE concentrating countries) whereas others are
above median values of non-SPE concentrating countries. Headline income
tax rates do not seem to be the unique responsible factor for concentrations
of SPEs in Europe.
4. Measurement and quality
The ECB fact finding [ECB 2017] assessed how relevant SPEs were for the
overall i.i.p. Three SPE concentrating countries responding to the survey (see
Table 2 below) indicated that SPEs accounted for more than half of the i.i.p.
total assets. Other responding countries listed between 0 and 10 percent. To
a very large degree, the assets belong to the functional category of FDI,
although portfolio and other investment, and financial derivative assets were
also reported. Similarly, FDI was also prevalent on the liability side, but not so
exclusively. For example the Netherlands and Luxembourg reported significant
amounts as portfolio and other investment. There is thus a large impact of
SPEs on the total i.i.p. of SPE concentrating countries and consequently the
accurate and consistent recording of SPEs transactions and positions is highly
relevant for the quality of the national b.o.p./i.i.p. as well as for European
aggregates.
416 | I S I W S C 2 0 1 9