
Page 94 - Invited Paper Session (IPS) - Volume 2
P. 94
IPS184 Ivette F. et al.
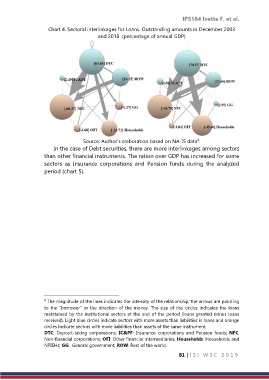
Chart 4. Sectoral interlinkages for Loans. Outstanding amounts in December 2003
and 2018 (percentage of annual GDP)
Source: Author’s elaboration based on NA-IS data .
8
In the case of Debt securities, there are more interlinkages among sectors
than other financial instruments. The ration over GDP has increased for some
sectors as Insurance corporations and Pension funds during the analyzed
period (chart 5).
8 The magnitude of the lines indicates the intensity of the relationship; the arrows are pointing
to the “borrower” or the direction of the money. The size of the circles indicates the loans
maintained by the institutional sectors at the end of the period (loans granted minus loans
received). Light blue circles indicate sectors with more assets than liabilities in loans and orange
circles indicate sectors with more liabilities than assets of the same instrument.
DTC: Deposit-taking corporations; IC&PF: Insurance corporations and Pension funds; NFC:
Non-financial corporations; OFI: Other financial intermediaries; Households: Households and
NPISHs; GG: General government; ROW: Rest of the world.
81 | I S I W S C 2 0 1 9