
Page 95 - Invited Paper Session (IPS) - Volume 2
P. 95
IPS184 Ivette F. et al.
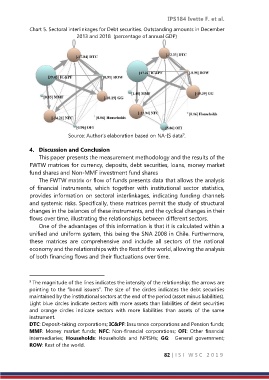
Chart 5. Sectoral interlinkages for Debt securities. Outstanding amounts in December
2013 and 2018 (percentage of annual GDP)
Source: Author’s elaboration based on NA-IS data .
9
4. Discussion and Conclusion
This paper presents the measurement methodology and the results of the
FWTW matrices for currency, deposits, debt securities, loans, money market
fund shares and Non-MMF investment fund shares
The FWTW matrix or flow of funds presents data that allows the analysis
of financial instruments, which together with institutional sector statistics,
provides information on sectoral interlinkages, indicating funding channels
and systemic risks. Specifically, these matrices permit the study of structural
changes in the balances of these instruments, and the cyclical changes in their
flows over time, illustrating the relationships between different sectors.
One of the advantages of this information is that it is calculated within a
unified and uniform system, this being the SNA 2008 in Chile. Furthermore,
these matrices are comprehensive and include all sectors of the national
economy and the relationships with the Rest of the world, allowing the analysis
of both financing flows and their fluctuations over time.
The magnitude of the lines indicates the intensity of the relationship; the arrows are
9
pointing to the “bond issuers”. The size of the circles indicates the debt securities
maintained by the institutional sectors at the end of the period (asset minus liabilities).
Light blue circles indicate sectors with more assets than liabilities of debt securities
and orange circles indicate sectors with more liabilities than assets of the same
instrument.
DTC: Deposit-taking corporations; IC&PF: Insurance corporations and Pension funds;
MMF: Money market funds; NFC: Non-financial corporations; OFI: Other financial
intermediaries; Households: Households and NPISHs; GG: General government;
ROW: Rest of the world.
82 | I S I W S C 2 0 1 9