
Page 206 - Special Topic Session (STS) - Volume 1
P. 206
STS425 Arifah B. et al.
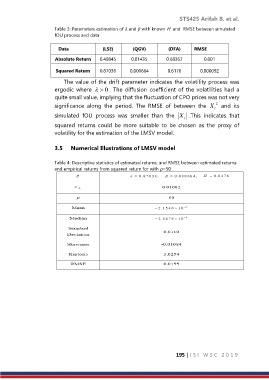
Table 3: Parameters estimation of and with known H and RMSE between simulated
fOU process and data
Data (LSE) (QGV) (DFA) RMSE
Absolute Return 0.49845 0.01435 0.68367 0.001
Squared Return 0.87036 0.000664 0.6176 0.000092
The value of the drift parameter indicates the volatility process was
ergodic where 0 . The diffusion coefficient of the volatilities had a
quite small value, implying that the fluctuation of CPO prices was not very
significance along the period. The RMSE of between the X t 2 and its
simulated fOU process was smaller than the X t .This indicates that
squared returns could be more suitable to be chosen as the proxy of
volatility for the estimation of the LMSV model.
3.5 Numerical Illustrations of LMSV model
Table 4: Descriptive statistics of estimated returns, and RMSE between estimated returns
and empirical returns from squared return for with p=50
195 | I S I W S C 2 0 1 9